Applied
| Title | Preparatory studies towards Scientific deep drilling programme in Koyna-Warna region |
|---|---|
| Participants | N. Purnachandra Rao, Sukanta Roy, Mrinal Sen and Harsh Gupta |
| Sponsoring Agency | Ministry of Earth Sciences |
Work Description:
The Koyna region located close to the west coast of India is the most outstanding example of Reservoir Triggered Seismicity (RTS), where triggered earthquakes have been occurring in a restricted area of 20x30 sq km since the impoundment of Shivajisagar Lake in 1962. The continued seismicity ever since provides a unique opportunity to directly measure the physical and mechanical properties of rocks, pore fluid pressure, hydrology, temperature and other parameters of an active intra-plate seismic zone in the “near-field” of earthquakes – before, during and after their occurrence, at shallow depths accessible by drilling. In view of this, a scientific deep drilling experiment for earthquake studies is planned in the Koyna-Warna region where a ~ 7km deep borehole observatory is planned to be set up for direct and continuous monitoring leading to a better understanding of the mechanics of faulting and physics of the reservoir triggered earthquakes, which will contribute appreciably to earthquake hazard assessment in future.
Towards this goal, a suite of geophysical investigations at regional and local scales, like broadband Seismology, Broadband Magneto-Tellurics (MT), Deep Resistivity Sounding (DRS), Controlled Source Audio-frequency Magnetotellurics (CSAMT), land-based gravity-magnetics, airborne gravity-gradiometry and LiDAR surveys are being carried out to precisely delineate the sub-surface structure around the seismic zone, most prospective for scientific deep drilling and fault zone investigations (figure 1.1). This is supplemented by about 9 – 10 exploratory boreholes ~1.5 km deep, surrounding the seismic zone. Apart from a suite of borehole investigations including geophysical logging and hydrogeology, borehole Seismology is being undertaken in these boreholes for precise delineation of hypocentral trends and fault plane geometry for taking up the deep drilling experiment.
The present study based on a multi-disciplinary approach is expected to provide a plethora of valuable geological, geophysical and geotechnical data from the boreholes. One of the major outcomes would be the accurate hypocentral locations of the order of a few tens of meters through inversion of travel time data recorded on borehole seismometers. This would be critical for delineating the fault zone in the study region. Further, modeling of borehole seismic waveform data including the fault guided waves will provide an additional, independent constraint on delineation of fault zone for planning of the deep borehole drilling in future. The structural changes with depth obtained from drilling, the various ongoing geophysical studies including MT, DRS and CSAMT, characteristics of water bearing formations identified at various depths through hydrogeological investigations and the surface geological and geomorphological results from airborne LiDAR would form the basis for further planning of the deep drilling experiment and modeling of the reservoir trigger mechanism in future.
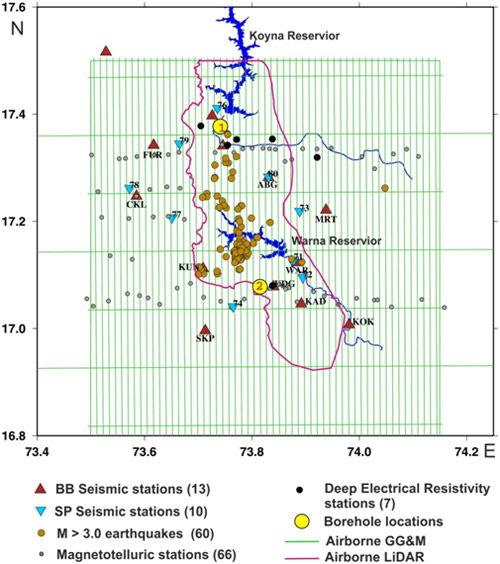
Fig.1.1: Ongoing studies in the Koyna-Warna region
| Title | Aquifer characterization using advance geophysical techniques in representative geological terrains of India [AQUIM] |
|---|---|
| Participants | Shakeel Ahmed, Somvanshi, . Subhash Chandra, . N.C.Mondal, . Tanvi Arora , Sheshamma, Nagaiah, Abdul Khaleel,Rakesh, Veerababu, Pradeep, Deepak, Satish, Dhanashree, Abhijeet, Vikram, Sarah, Farooq Ahmad Dar, Tirupathi, Ramya, Ahmeduddin, Tarun, Raghavendra, Kapil, Satyajit, Rekha, Mehak , Manikandhan, Manish, Jai Prakash |
| Sponsoring Agency | CGWB/MoWR, World Bank |
Work Description:
Under the National Aquifer Mapping Programme of Govt. of India, state of the art geophysical investigation are being carried out: (1) To delineate the principal aquifers up to 200 m depth in hard rocks and 300 m depth in sedimentary areas, (2) To establish of the efficacy of various geophysical techniques under different hydrogeological conditions, and (3) To develop of a suitable methodology for geophysical investigations, as a pilot project (AQUIM) to be up-scaled for the entire country. In this flagship project, CSIR-NGRI has undertaken a pilot study for 6 areas in different hydrogeological terrains covering 1) thick alluvium overlying hard rock of Rajasthan (AQRAJ), 2) basaltic traps underlain by thick Gondwana sediments in Maharashtra (AQMAH), 3) Complex crystalline rocks of Karnataka (AQKAR), 4) thick alluvial plains of Ganga basin in Bihar(AQBHR), 5) coastal sediments of Tamil Nadu (AQTND) and 6) desert of Rajasthan (AQDRT) (Figure 2.1) representing the most of the geological formation present. The project is of two folds i.e., (1) Ground-based geophysics and (2) Heliborne geophysics. Until now CSIR-NGRI has conducted surface geophysical surveys comprising Vertical Electrical Sounding (VES), Time Domain Electromagnetic Sounding (TEM) and Electrical Resistivity Tomography (ERT) in the above six areas.
(i) AQRAJ Area
AQRAJ area of 598 km2 in parts of Dausa district, Rajasthan forms a part of Banganga basin located towards north of the east flowing Banganga River. This area represents hard rock overlain by alluvium. Thin sand and gravel form the aquifers in 80-90 m thick alluvial cover overlying hard rocks. It suffers from fluoride, iron, nitrate contaminations, salinity and over exploitation. The stage of groundwater development (SGWD) is 173%. In this pilot area, 51 VES, 73 TEM and 2 line-km ERT were conduced (Figure 2.1). The results indicate the maximum depth to bed rock around 105 m in southeastern parts. A moderately thick (15-29 m) saturated zone, the aquifer in the alluvium immediately overlying the bed rock has been delineated at most of the sites . Hydrogeophysical cross-sections prepared on the basis of VES and TEM have identified a few potential areas of deep aquifers.
(ii) AQMAH Area
AQMAH represents basaltic terrain underlain by Gondwana sediments and Archean metamorphic at some places covering an area of 360 km2 in north-western parts of Nagpur district, Maharashtra. Aquifers composed of weathered and vesicular basalts and underlying Gondwana sandstones occur at 150 to 200 m depths. In this area, 20 VES, 52 TEM and 17 line-km ERT were conducted (Figure 2.1). The ERT images exhibit clearly basaltic flow pattern lying between 30-80 m depths. Resistivity ranges, though observed low, indicate increasing trend towards south and reaches up to 400 Ω-m. Such a flow is expected to be continuous. However, observed low resistivity breaks within the ERT profile over basaltic terrain could be inferred as weak zone forming potential groundwater bearing zones.
Further, the TEM data were utilized to construct resistivity section aligned in NS following the same alignment as ERT. The TEM data is corrected for elevation and presented in Figure 2.2a. Associated ERT data pattern and inferred geological set up are also shown in Figures 2.2b & c. Likewise, the individual ERT images discussed above revealed a good correlation with TEM results.Since both the measurement is are limited to 100 m depth of investigation, basaltic flow at deeper level could not be mapped. However, both the measurements indicated relatively low order of resistivity corresponding to Gondwanas and alternate layering of low, high and low resistivity due to basaltic flows, associated with alterations and the intertrappeans. The 15 km long N-S ERT profile across the basaltic traps flanked by exposures of Gondwanas has revealed the disposition of weathered and compact basalts, their lateral continuity, the aquifer characteristics of the weathered zone and underlying vesicular basalts, that of the Gondwanas and the steeply dipping discontinuities in the basalts favorable as groundwater repositories.
(iii) AQKAR Area
AQKAR area of 376 km2 in Tumkur district, Karnataka represents Archean crystalline. The main aquifer is composed of lower weathered and fractures zones. In this area, 34 VES, 26 TEM and 13.6 line-km ERT were conducted (Figure 2.1). The saturated part of the weathered zone forming the shallow aquifer and the deeper saturated fracture zones could be identified from the VES and TEM results. The ERT has been effective in identifying areas with thickening of weathered zone and the aquifer in it. The thickness of groundwater saturated zone map was prepared for the month of February 2013 by subtracting the depth to water level obtained from CGWB from the VES inferred depth to bed rock. It was found that the thickness of saturated zone generally varies from 0 (over the exposed hillocks) to 20 m and higher thicknesses were observed at few points. A major part of the present study area is occupied by negative values indicating that the depth to water level is below the bed rock depth. In such areas the weathered zone is almost dry and water is tapped from the fractured zones within the bedrock. Inferred bed rock levels were considered as reference line (‘0’) and with respect to that, the saturated thickness map was prepared with (+) water level above the bed rock and (-) water level below the bed rock. The attempt has shown clearly the areas of over-exploitation and the areas with moderate to less groundwater potential. Preparation of such maps for pre- & post-monsoon periods may attribute to identification of recharge areas over this pilot area.
(iv) AQBHR Area
AQBHR area of 521 km2 in Patna district, Bihar in Middle Ganga Plain (MGP) represents a thick sequence of Ganga alluvium resting over the pre-Tertiary formations holding a multi-aquifer system. In this pilot area, 50 VES, 58 TEM and 19 line-km ERT were conducted (Figure 2.1) with the main objective of delineating different aquifer stages up to the depth of 300 m and beyond. The deep VES were carried out for the first time revealed the presence of resistive basement in the southern part at about 600 m depth. It is also able to identify different stages of aquifer depositions to the depth beyond 300 m. It's correlation with exploratory bore well lithology yielded good similarities making VES as a potential tool in aquifer mapping. Apart from the areal delineation of aquifer system, the ground geophysical surveys identified some lithological discontinuity in the study area which could be further established through other geophysical methods. This will form an important aspect of understanding the hydraulic connectivity of aquifers regionally in alluvium area. Few cross-sections at the selective sites were prepared to understand the aquifers extension and its geometry. The behavior of sub-surface geoelectrical responses enabled in identifying the deepening of aquifers towards northern part of the study area. Sometime the VES along was not resolved clay zone having thickness around 10 m sitting below around 100 depth acting a barrier between the first and second principal aquifers, But the upper boundary of this clay layer was demarcated clearly with the aid of Ground TEM data. It was also demonstrated that the depth of first principal aquifer could be delineated easily using the TEM data in the entire pilot area. ERT is found to be a good tool of exploration in palaeo-channels which in general exist in the major river basins and also able to map top of the first principal aquifer and extended down to 100m (bgl) using 48 electrodes with 10 m spacing.
(v) AQTND Area
AQTND area of 234 km2 falls in parts of Cuddalore district, Tamil Nadu. It represents alluvium underlain by thick coastal sediments of Tertiary and Cretaceous age resting over the crystalline basement. In this area, 20 VES, 15 TEM and 10.8 line-km ERT were conducted. The sub-surface deeper response of the soundings observed on the northern part is distinctly different from the response of the other soundings observed in the southern part. The unique responses of these two segments indirectly reflect the textural nature of deeper sediments forming different geo-electric layers. The behavioral pattern of sounding curves able to distinguish Arenaceous and Argillaceous facies of sediments below the laterite cap rock. The TEM results were compared with a litholog data of nearest exploratory well near NLC (Figure 2.3). Lithology has been inferred from the interpreted layer parameter of the TEM conductivity data. The interpretation up to the depth of 160 m yielded 6 layers of alternative sand and clay formation with associated lignite-clay beds. The comparison of lithology observed from the bore hole and the interpreted layer parameters shows good correlation. Although the lignite has small thickness, the associated clay layer helps in delineating the composite layers. Further the TEM result is very effective in differentiating the saline-fresh aquifer interface in the east and the lignite beds associated with clay beds in the west. The survey carried out at several locations across the coast-line; clearly indicate the depth and thickness of shallow fresh water aquifer zone. The 2-D resistivity tomography also clearly mapped the aquifer salinity influenced by the sea incursion to a depth of 60-80 m near the coast in this area.
(vi) AQDRT Area
AQDRT area of 675 km2 lies in Sam Panchayat Samiti (block), Jaisalmer district in Western Rajasthan. It forms a part of Western Arid Plain. It represents a typical area in Thar desert with a pile of dry Aeolian sand, alluvium, sandstone and limestone resting over crystalline basement. This area is being affected by groundwater salinity and falls in critically exploited category. Fresh water aquifers are in the alluvium underlying the desert sand. The thickness of desert sand and alluvium varies from 10 to 100 m. The underlying sandstone and limestone hold thick potential aquifer. Groundwater is brackish to saline nature at some places.
In this pilot area, only 8 TEM were conducted on an experimental basis starting from Sanu village to Ranao along Ramgarh town (Figure 2.1). The TEM result is found quite responsive to the subsurface resistivity distribution in this desert area. A hydrogeological section (SN-direction) was prepared based on the TEM results, whichindicates limestone at a depth around 63 m in the south (at DT1). The middle portion located at Ramgarh town shows different hydrogeological unit with complete contrast in conductivity as an indicative of saline water zone. A huge pile of dry Aeolian sand dunes underlain by saline water zone are encountered in the northern portion (at DT9). The interfaces between dry sand and underlying saline water zone and the compact formation could be delineated to depths beyond 100 m.
Thus an integration of surface geophysical methods (i.e., VES and TEM) has clearly revealed the effectiveness in jointly minimizing the ambiguities inherent in these techniques. The TEM sounding being quite fast in field operation and requiring less surface spread could be the best alternative and supplementary under favourable hydrogeological conditions. The TEM sounding could be effective in delineating the conductive clay layers. The effectiveness of long ERT profile and the application of laterally constrained inversion (LCI) could be established in delineating the regional subsurface hydrogeological setup. However, the terrain wise establishment of geophysical methodology and its up-scaling for the NAQUIM programe will be finalized after completion of the remaining surface geophysical surveys and the heliborne surveys.
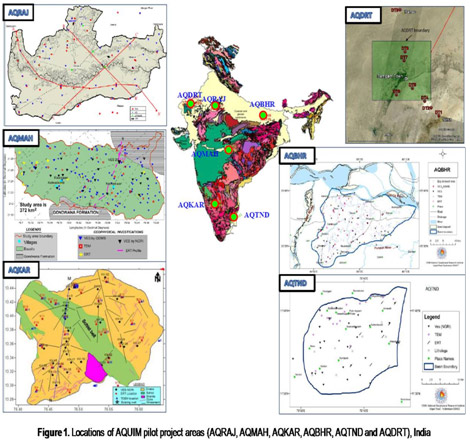
Fig.2.1: Locations of AQUIM pilot project areas(AQRAJ, AQMAH, AQKAR, AQTND and AQDRT), India
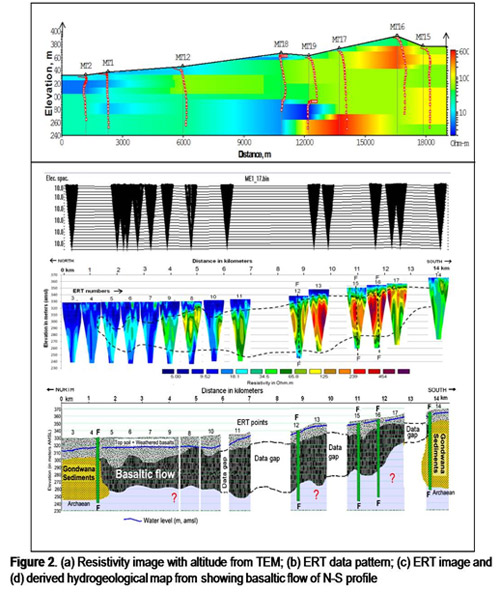
Fig.2.2(a):
Resistivity image with altitude from TEM;(b) ERT data pattern;(c)ERT image and (d)derived hydrogeological map from showing basaltic flow of N-S profile
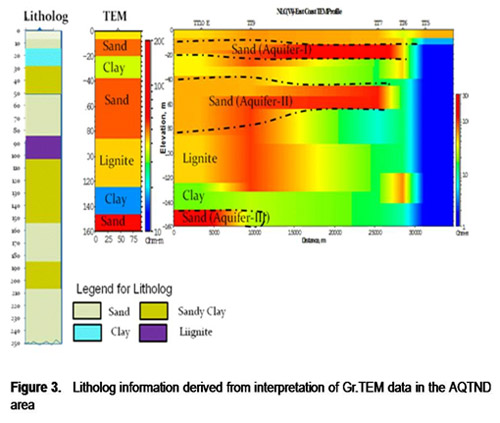
Fig.2.3:
Litholog information derived from interpretation of Gr.TEM data in the AQTND area
| Title | GROUNDWATER EXPLORATION FOR SOURCE CREATION AND RECHARGE SITES LOCATION |
|---|---|
| Participants | S.N. Rai, S. Thiyagarajan, Dewashish Kumar,. G.B.K. Shankar, M. Sattesh Kumar and. R. Rangarajan |
| Sponsoring Agency | CSIR-NGRI |
Work Description:
(i) Electrical Resistivity Tomography for groundwater exploration in basaltic terrain of Tawarja basin, Latur district, Maharashtra
Electrical Resistivity Tomography has been carried out at 15 locations in the western part of the Tawarja river basin (Latitudes: 18o 12’ 16” – 18 o 24’ 15” and Longitudes: 76o 15’ 22” – 76 o 41’ 35”), Latur district which is a part of draught prone area in Marathwada region of Maharashtra State. The basin is occupied by Deccan traps basalt formation and receives an average annual rainfall of 880 mm. This region is facing acute shortage of water supply to meet the requirements of irrigation and drinking water. The groundwater in the unconfined aquifers has been completely exploited. Therefore, deeper sources of groundwater within the traps need to be delineated to meet the water supply demand. Groundwater potential zones within the intertrappean sedimentary formations between two successive lava flows and in fracture zones have been delineated at several locations in the investigated area. Interpreted result about the occurrence of groundwater potential zone has been verified by drilling a bore well at a site falling under administrative limit of Karkota village.
(S.N. Rai, S. Thiagarajan, G.B.K. Shankar and M. Sateesh Kumar)
(ii) Exploring groundwater at CSIR-NGRI campus
CSIR-National Geophysical Research Institute is geographically located between 78o 32’49.2” to 78o 33’25.2” E longitudes and 17o 24’28.8” to 17o 25’8.4” N latitudes in the capital city of Hyderabad. Location map of the study area is shown in
Fig. 3.1. Electrical Resistivity Tomography along eight profiles is carried out within the campus to delineate groundwater potential zones characterized by resistivity value < 45 Ohm m and that of massive granite is > 70 Ohm m resistivity values. Inverse resistivity model of ERT at E7 site and colored index of the resistivity values are given below the model. A new bore well drilled at E7 yielded 1.5 liters per second. Groundwater flow from the bore well is also shown in Fig. 3.3.
(S.N. Rai, S. Thiagarajan and Dewashish Kumar)
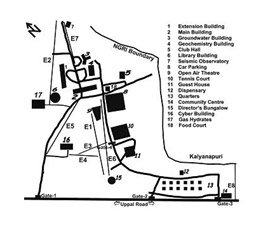
Fig.3.1:
Location of ERT sites (E1 to E7)in NGRI campus
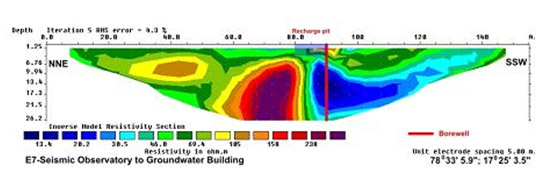
Fig.3.2:
Resistivity imaging at a site near Groundwater building
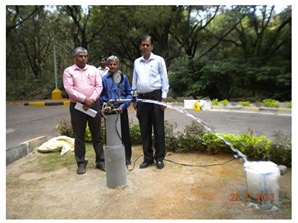
Fig.3.3:
Wavelet power spectra for the periods 5 to 2 years for all the data sets used in the study
(iii) Groundwater exploration in Koilagudem village revenue area, Nalgonda district, A.P.
Koilagudem village in Choutuppal Mandal of Nalgonda district was referred by the Honorable Governor of Andhra Pradesh to take up scientific studies to solve the drinking water problem of this village. Vertical Electrical sounding (VES) at 3 sites in the area around the village and ERT imaging were taken at 2 sites in a Tangadapalle cheruvu area adjacent to this village for source finding
A borehole site was identified in the village revenue area and drilling was recommended to a depth of 100 m for supporting the present water supply scheme. A large diameter dug well (6-8 m dia) to a depth of 15 m at a selected site in the Tangadapalle cheruvu was also recommended. The dug well source may be adequate to meet the requirements of Koilagudem and other villages.
| Title | Long-term system evolution of the Krishna-Godavari Basin and its hinterland in eastern India: a partnership for enhancing offshore hydrocarbon exploration success |
|---|---|
| Participants | Devender Kumar |
| Sponsoring Agency | Department of Science and Technology (DST), Government of India under the India-Australia Strategic Research Fund (IASRF) Scheme |
Work Description:
The main emphasis of this study has been to to infer the preliminary thermal history analysis and provenance of Pranhita-Godavari (P-G) Basin sediments from a borehole using apatite fission track (AFT), organic maturity and zircon U-Pb data
Located at the boundary of Dharwar and Bastar cratons, Pranhita-Godavari (P-G) basin extends ~400 km trending NNW–SSE in the central Indian peninsula and offshore. This intra-cratonic Proterozoic rift basin hosts a Permo-Triassic Gondwana sequence attaining a total thickness up to 3000 m. AFT analysis was carried out on 15 samples from cores and cuttings collected over a depth range of 500-2950 m belonging to an exploratory borehole located in the southern part of the basin. AFT ages decrease systematically with depth from 242±23 to 11.5±0.5 Ma. U/Pb zircon ages (determined by LA-ICP-MS) on detrital grains from two Triassic samples in this borehole were carried out. The probability density distribution of the U/Pb ages from both samples are generally clustered into four groupings (i) 500 Ma and 650 Ma, (ii) 800 Ma to 1100 Ma, (iii) 1300 Ma to 1500 Ma and (iv) 2400 to 2600 Ma. Except the uppermost sample at the depth of ~540 m, all deeper samples yield AFT ages younger than the time of deposition. As the present day geothermal gradient in the well is ~29°C/km, this indicates that samples might have experienced some post-depositional heating. This is also confirmed independently by thermal maturity data (% Ro, Rock-Eval® pyrolysis). A preliminary interpretation suggests that this age pattern has resulted from the removal of at least ~1 km of overlying section. Evidence from palaeocurrent studies [Kent, 1991, Geology, 19, 19-23] indicating a sediment source from the southeast of the basin together with the U-Pb detrital zircon data (which correlate well with the earlier studies e.g. Veevers and Saeed, 2009, confirm Antarctica as the major source of sedimentation in the P-G basin.
| Title | Impacts of meso-scale watershed development in AP and their implications for designing and implementing improved WSD policies and programs. |
|---|---|
| Participants | P.D.Sreedevi, Fakhre Alam, Sarah, Raghavendra, Naazish Rana, Mohd. Ahmeddudin, Shakeel Ahmed |
| Participants | P.D.Sreedevi, Fakhre Alam, Sarah, Raghavendra, Naazish Rana, Mohd. Ahmeddudin, Shakeel Ahmed |
| Sponsoring Agency | ACIAR, Australia |
Work Description:
Objective:
- 1. Collection and compilation of socio-economic, hydrological, crop, WSD and climate models and data for the two selected sites in India.
- 2. Design and execution of social- economic and livelihood surveys.
- 3. Development and validation of a linked surface and groundwater model.
Study area:
First Study Site (Anantapur & Kurnool District): Two watershed i.e. Maruva vanka and Vajrala vanka (
Fig. 5.1a) lies in both Anantapur & Kurnool district. It is situated between latitude 15.130 and 15.300N and longitude 77.570 and 77.730 E and covers an area of about 15619 Ha.
Second Study Site (Prakasam District): Second study area i.e. Peethuruvagu watershed (
Fig. 5.1b) lies in the south-west part of Prakasam district and between latitude 15.33 and 15.550N and longitude 79.030 and 79.120 E, covers an area of about 9425 Ha.
Progress summary:
The focus has been to develop and populate an integrated evaluation framework for watershed development (WSD) with livelihoods data and an underpinning understanding created by groundwater and land use models. To achieve integration between socioeconomic, hydrogeology and bio-physical issues there are monthly meetings of the India team. The team has conducted a joint field visit to validate the preliminary results.
There has also been a simple model for the Prakasam site to provide a means whereby the optimal sitting of Meso-WSD over a hydrological unit can be informed. That is since initially the whole of the HUN unit is unlikely to be covered a pattern of application that is selected by overall influence on groundwater impact and \or likelihood of maximising ease of adoption can be selected rather than the current largely ad-hoc approach.
Integrated Livelihoods Based model
Bayesian network models (BNM) have been developed using data from the resilience survey data set. Sub-models have been developed for each of the five capitals (Social, Human, Physical, Financial and Natural capitals). Resilience variables are described as the contribution to household survival of 0, 1, 2 or 3 consecutive years of drought. The resilience variables are linked to a final outcome variable which describes the strength of household capital.
The Capitals have been underpinned from survey data.
- Primary data collection covering more than 1100 households in 8 villages (6 with watershed and 2 without watershed) in the two selected hydrological units HUNs was completed. A separate resilience survey covering all the sample households (560) was also completed.
- Livelihoods and Natural Resource Management Institute (LNRMI) has completed the primary analysis of the data (Tabulation) and started writing up the analysis.
- Second level analysis estimating production functions and factors influencing resilience is underway.
- The results have been presented to the communities in a process of validating the results.
- The primary data is being used for resilience modelling as well as the Bayesian Network.
Geophysical and groundwater evaluation:
A detailed geophysical investigation in the form of Electrical Resistivity Tomography was carried out at ten locations with a dipole-dipole configuration at Vajrala and Maruva vanka watershed with the purpose of delineating the approximate depth of the layers and depth to basement.
From the groundwater evaluation it is evident that the consumption of groundwater has greatly increased in the area during a decade or so and is directly proportional to the rise in population, and expansion and diversification of agricultural activities. Therefore, quantitative evaluation of groundwater resources of the area is an essential pre-requisite for its judicious management. In this regard groundwater storage for four villages in Maruva vanka and Vajrala vanka watershed and three villages in Peethuruvagu watershed was carried out for seven hydrological years.
The groundwater budget from 2005 to present has been estimated with the help of landuse/landcover map. Lithologically constrained rainfall (LCR) approach has been used for estimating natural recharge in the watersheds because no water level data is available before 2005.
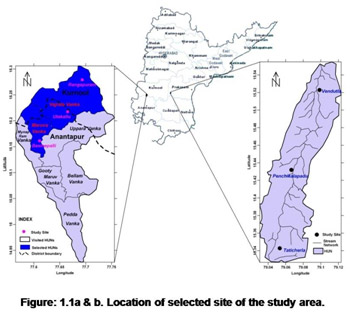
Fig.5.1:
a & b Location of selected site of the study area
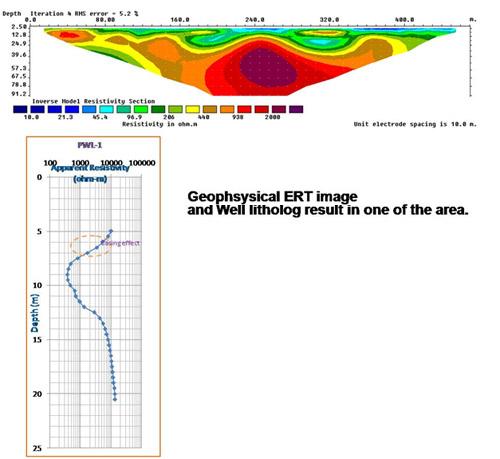
Fig.5.2:
a & b Geophysical ERT image and well litholog result in one of the area
| Title | Hydrology and water resources from space over the Indian continent |
|---|---|
| Participants | V.M. Tiwari, B. Singh, A. E. Meshram, N. Srinivas, and collaborators |
| Sponsoring Agency | Indo-French Centre for the Promotion of Advanced Research (CEFIPRA), New Delhi |
Work Description:
GRACE satellite gravity data over the main Indian river basins (Ganga, Krishna, Godavari, Brahmaputra and Indus) is analyzed and time series of integrated vertical water content have been produced over these basins. To understand spatio-tempopral variation of water storage over these basins, an empirical Orthogonal Function (EOF) has been also applied to the GRACE time series and results are interpreted in terms of natural and anthropogenic causes. The water level time series over the various major Indian rivers (Ganga, Krishna, Indus, Godavari, Bhramputra) and their main tributaries are computed using the various satellite missions as T/P, Envisat, Jason-1/2. Precise information of geoid undulations is essential for determining orthometric heights from GPS and also offers information of subsurface density heterogeneities. We computed geoid undulations over southern Indian region (Figure6.1)from terrestrial gravity and elevation data using remove-restore technique that involves computation of Stokes’s coefficients through spherical Fast Fourier Transform (FFT) (Figure 6.2). We noticed that the gravimetric geoid shows an improvement in precision and reliability, fitting the geoidal heights measured for the validation points better than EGM2008 and EIGEN-GRACE02S in the south Indian Region (Figure 6.3).
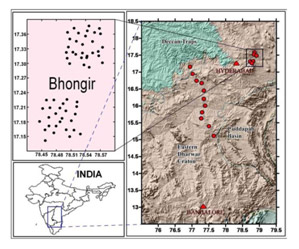
Fig.6.1:
Location of study area showing coordinates of GPS locations with known first order leveling bench marks.
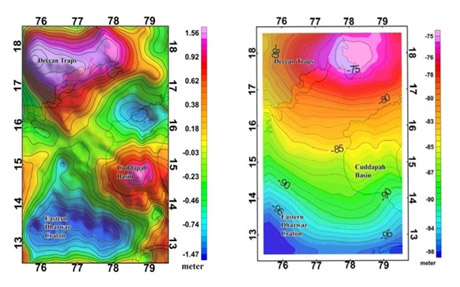
Fig.6.2:
a and 6.2.b: Plots of Residual Geoid and Final Gravimetric Geoid of study region respectively.
Fig.6.3:
a, 6.3b and 6.3c (Histograms) shows the differences of N GPS\Levelling geoid -N EGM2008 , N GPS\Levelling geoid -N EIGEN-GRACE02S and N GPS\Levelling geoid -N Gravimetric for Region A, B and C respectively
| Title | GROUNDWATER DATA GENERATION AT NPP SITES - SSP-563-28(RR) |
|---|---|
| Participants | R. Rangarajan, G.B.K. Shankar, Kamle Anand, D. Muralidharan, V.S. Singh, A. Mohan Reddy |
| Sponsoring Agency | BARC, Mumbai |
Work Description:
A research project study “Groundwater data generation at NPP sites” was formulated with BARC, Mumbai for generating hydro-geological data base at Tarapur Atomic Power Station (TAPS) site, near Mumbai for development of predictive surface and groundwater models at Nuclear Power Plant sites. The ultimate objective of the project is for determining the site safety and environment impact. The project entails basic groundwater data generation at the Nuclear Power Plant (NPP) site by CSIR NGRI followed by developing numerical groundwater models by BARC, Mumbai.The TAPS site (5 km2) adjacent to west coast line near Tarapur village in Palghar taluk of Thane district, Maharashtra state, receives an average annual rainfall of 1760 mm. The area is underlain by Deccan Trap Basalt formation with the thickness of about 1000 m. Groundwater occurs under water table and semi-confined conditions with the static water level vary from 1-6.5 m bgl. Hydrogeological, geophysical and tracer techniques were used at selected sites (Fig. 7.1) and in newly drilled bore holes in the study area for understanding subsurface geological characteristics, such as hydraulic conditions, rainfall recharge rates, vadoze zone parameters, aquifer characteristics, groundwater flow pattern, velocity of groundwater, chemical characteristics, radioactive contamination etc.
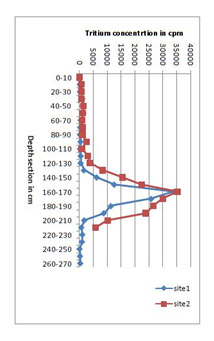
Fig. 7.2 shows the resistivity image at a site in the TAPS area. The figure clearly depicted a two layer geo-electrical structure representing the top soil followed by highly weathered basalts with high saturation as the first layer, extending to a depth of 5-6 m. This layer is followed by resistive layer with more than 40 Ohm-m which is the compact basalt of the flow unit. The rise of groundwater level in observation wells in the area is proportional to the quantum and intensity of rainfall events. The fast decline of water level during end of monsoon and post monsoon season indicates that the groundwater is in dynamic condition and quick outflow from the area to the seaward side as the area did not have any high groundwater withdrawal. The groundwater flow maps during monsoon based on reduced water levels of bore wells indicates, that the movement of groundwater is towards north, eastern and western side (Fig.7.3). The actual velocity (induced and natural condition) are calculated based on filtration velocity obtained through tracer technique and by taking into account the effective porosity of aquifer formations. The velocity values calculated under natural condition range from 0.53 m/d to 2.12 m/d. The velocity values calculated under induced condition range from 7.4 m/d to 38.8 m/d. Natural recharge values obtained using tritium injection technique shows that the recharge rate is 187.4 mm or 6.6 % of the effective rainfall. Lower recharge rate is mainly due to presence of shallow water table condition during the monsoon period. The analytical data of groundwater samples indicates that in most of the cases, the Total Dissolved Solids and concentrations of ions are within the permissible limit for drinking water and the dominant groundwater in the complex are CaHCO3 and Na-CaHCO3 types. The conductivity data also shows that there is no sea water intrusion to the fresh water aquifers at moderate aquifer depth level.
The saturated and unsaturated zone data generated under the project is used in development of predictive groundwater models for formulating site safety measures.
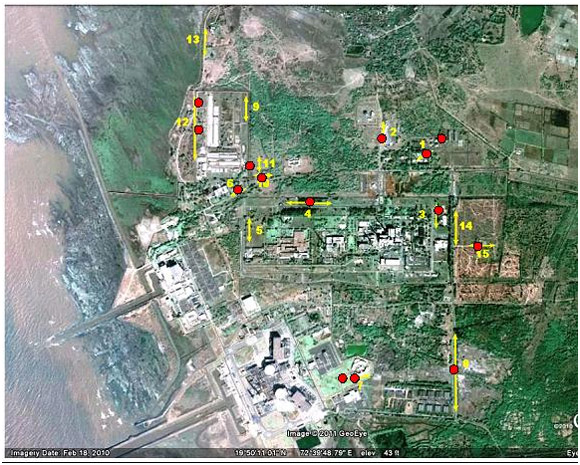
Fig.7.1:
Location map of TAPS area with experimental sites
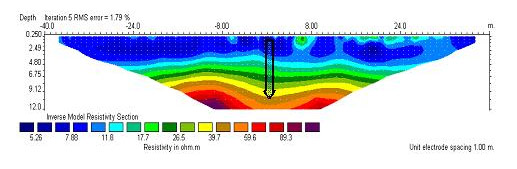
Fig.7.2:
Resistivity imaging at a site in TAPS
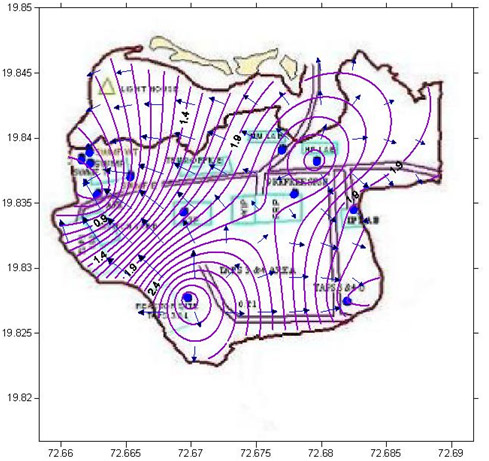
Fig.7.3:
Groundwater flow map during monsoon in TAPS
| Title | HYDROGEOLOGICAL DATA GENERATION FOR MAPPING THE GROUND WATER REGIME, NFC CAMPUS, HYDERABAD - SSP-636-28(RR) |
|---|---|
| Participants | R. Rangarajan, G.B.K. Shankar, Kamle Anand, V. Venkatesam, . K. Rajeshwar, . Rama Devi, . D. Muralidharan, . A. Mohan Reddy |
| Sponsoring Agency | NFC, Hyderabad |
Work Description:
Integrated scientific studies comprising hydrological & hydrogeological monitoring, geophysical, geochemical and tracer experiments were carried out within NFC main campus and adjacent Solar Evaporation Pond (SEP) areas for knowing subsurface geology, understanding prevailing hydrogeolgical conditions, recharge rate and ground water flow dynamics and the cause of groundwater pollution.
The important observations / findings / conclusions based on the project study are;
The scale of resistivity values obtained from resistivity sounding survey and through litho logs of bore holes drilled up to the maximum depth of 48 m in NFC main campus and solar evaporation pond area (waste disposal site) indicate occurrence of thick weathered to semi weathered zones followed by one or more fracture zones of 3-5 feet thickness within the depth zone of 30 m. The approximate yield of the wells in NFC site range from 121 – 671 gph. Groundwater flow maps of NFC main campus indicate the flow pattern is from north and northwest to south and southeastern side coinciding with drainage pattern (Fig. 8.1). In SEP area, the groundwater flow pattern is complicated. In the northern part, the movement is from northwest to south and east and in the southern part, it is from east to west, southwest and south. A marked water divide is observed in the middle part of the area in W-E direction with significance on east-central part (Fig.8. 2).Natural recharge study using tritium injection technique indicates moderate to high recharge during 2012 monsoon. Average rainfall recharge of 146.8 mm was estimated from tritium profiles for 2012 monsoon (Fig. 8.3). High recharge is due to several moderate rainfall events of 40-60 mm/d, high intensity rainfall event of 140 mm/d during 2012 monsoon and favorable soil conditions. Aquifer parameters determined by pumping tests at newly drilled NGRI wells yielded Transmissivity in the range of 12.5 to 275 m2/d and Storage Coefficient in the range of 2.0x10⁻³ to 5x10⁻⁴. The actual velocity of groundwater flow at selected sites is calculated under different effective porosity conditions of the aquifer formation (6-10 %). The calculated values indicate that velocity of groundwater flow varies from 3.39 - 10.64 m/d in northern part and 1.26 - 1.72 m/d in the southern part. It can be considered that the flow rate measured in the northern part is under induced condition and the flow in the southern part is under natural flow condition. The results of the tracer study conducted at newly drilled bore wells have helped in identifying the pollution plume pathway within the NFC complex area. The analytical data of groundwater samples collected from newly drilled bore wells in NFC main campus and SEP area indicates that in most of the cases, the Total Dissolved Solids and concentrations of ions are within / slightly above the permissible limit of drinking water. The trace element analysis also shows that the concentrations of most of the elements are within the permissible limit for drinking water. Integrated geohydrological investigation enabled in deciphering the shallow aquifer system in NFC campus and waste disposal areas.
The findings helped the NFC authorities to formulate suitable strategies in controlling the anticipated contamination due to their activities within their active area.
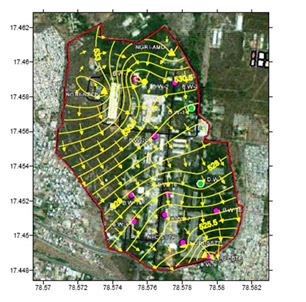
Fig.8.1:
Groundwater flow map in NFC main campus
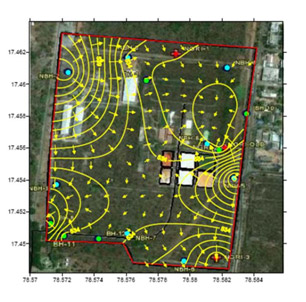
Fig.8.2:
Groundwater flow map in solar evaporation pond
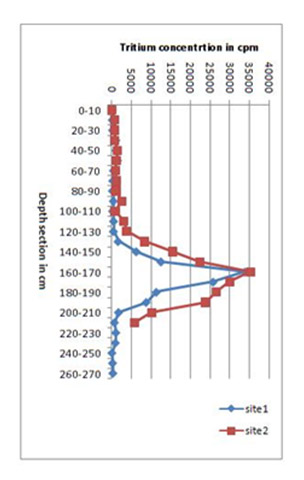
Fig.8.3:
Tritium profiles at natural recharge sites
| Title | Saph-Pani Project |
|---|---|
| Participants | Tanvi Arora, Farooq Ahmed Dar, Tarun Gaur, Naazish Rana, Rekha Gautam, Kapil Chhabbra, JP Mundari,Sahebrao Sonkamble, Deepa N Kapardar, Pratyusha Adepu, Shakeel Ahmed |
| Sponsoring Agency | FP7: European Union |
Work Description:
1. Geoelectrical Investigations in Raipur Area for the study of Managed aquifer recharge and soil aquifer treatment.
Raipur group is represented by Chandi Limestone and Deonagar Shale of the Chattisgarh Super Group formation. The Raipur limestone is a grey, fine grained, horizontally bedded, tromatolitic, massive limestone(Fig 9.1). While the primary porosity is negligible it has a distinct secondary porosity due to joints and karstification, which is supposed to occur in two horizons in Raipur city. Telibandha lake area lies on Deonagar shale formation which consists of laminated purple shale interbedded with ferruginous, thinly to thickly bedded sandstone with thicknesses of up to 4 m. It lies in the cusp of Chandi limestone and Deodongar shale.
Objectives of the study
- Electrical Resistivity Imaging (ERI) along the transition zones of shale and limestone outcrops.
- To bring a clear section of the subsurface in the area.
- Layered structure of the area with geological classification.
Electrical Resistivity Imaging -Station 1: AMLIDHI
Profile (Station 1) was laid down in NNW-SSE direction for the ERT data acquisition. The experimental field setup was laid along a profile of 480 m with the electrode spacing of 10 m. The Wenner-Schlumberger array was used to survey the profile. A total number of 529 datum points were measured at 23 data levels, which lead to the plotting of a pseudosection (fig. 9.2), by the observed data sets. There is single railway track parallel to the profile about 150-200 m away from the central electrode. There is also cemented road approximately 100 m away from the 1st electrode and also a pond approximately 10 m away. All the electrodes were well connected to the ground thus giving almost nil earth resistance. There is a nearby borewell which has a water depth of 20-40 ft, as information gathered from local sources. Some limestone was transported and dumped near the site.
The pseudosectioin shown in Fig.9.2 clearly brings out the layered structure of limestone exactly from the subsurface. At the depth of 5 m there is a thick layer of 15-20 mts thickness of damp limestone with resistivity varying between 50-150 ohm-m and below this is dry limestone up to 90 m with high resistivity of more than 300 ohm-m.
Station 2: DEVPURI
NNE-SSW trending ERT Profile at station 2 (Devpuri) is in open field near the railway track. The Wenner-Schlumberger array was used for resistivity measurements along 480 m profile. A total number of 529 datum points were measured at 23 data levels, which lead to the plotting of a pseudosection (fig. 9.3). The Vertical Electrical Soundings shows the three layered structure with top soil up to 2 m and a second layer of thickness 8-10 m. The pseudosection (Fig. 9.3) clearly brings out a weathered limestone or shaly limestone of nearly 50 ohm-m resistivity up to a depth of 10 m below the surface underlain by a hard/dry limestone up to a depth of 90 m with high resistivity above 150 ohm-m. An intrusive body, perhaps a hidden dyke of comparatively high resistivity below the subsurface at a depth of 18 m is to be confirmed as existence of such intrusive bodies in Karst aquifers are not yet reported using ERT technique.
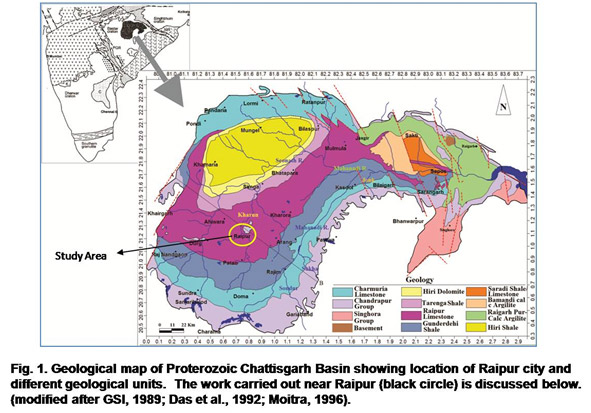
Fig.9.1:
Geological map of peterozoic chattisgarh basin showing location of Raipur city and different geological units.The work carried out near Raipur(black circle) id discussed below .(modified agter GSI, 1989; Das at al., 1992; Moitra, 1996)
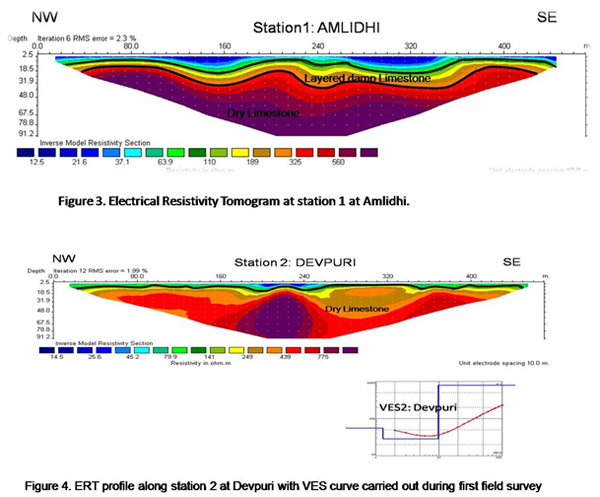
Fig.9.2:
ERT at station 1 at Amlidhi and Fig 11.4 ERT at station 2 and VES 2 at Devpuri
The Musi River which flows through the city of Hyderabad, receives over a 1.2 million m3/day of wastewater (both domestic and industrial) from the city which is only partially treated and used for irrigation, directly through irrigation canals. The wastewater, a significant resource in this semi-arid peri urban environment is used for the cultivation of fodder grass, paddy and vegetables Year round cultivation, which generates large return flows from irrigated fields, contributes to a large share of the aquifer recharge. NGRI is one of the partners in Saph-Pani Project in order to enhance the natural treatment systems such as wetlands existing in the proximity of the river. The experimental site of 2.8 km2 located 10 km downstream of the Musi River, Hyderabad (Fig. 9.1) has been selected for the pilot study. The main objectives are 1) to identify strategies for enhancement of natural waste water treatment, and 2) to assess the effectiveness and sustainability of wetlands and soil aquifer treatment (SAT) for treating wastewater in a context of peri-urban agriculture.
To meet the above objectives, the test site has been monitored to characterize the hydrodynamics and chemical gradient among wastewater, groundwater, soil, and plant biomass for two hydrological years. In addition to these, a regular monitoring of static water level and in-situ pH,
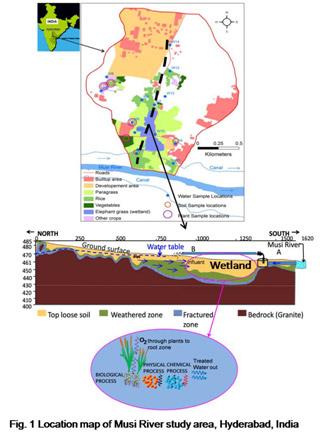
Fig.9.3:
Location map of Musi River study area, Hyderabad, India
electrical conductivity and dissolved oxygen from the existing piezometers are being carried out. Hydrogeologically, the test site shows, the groundwater occurs in unconfined and confined conditions where the hydraulic gradient is towards the main stream following topography. The conceptual model (Fig. 9.1) shows that the natural wetland system with a 30 m depth to hard rock has a great scope for the biotransformation of chemical pollutants. The primary results of chemical scanning of water, soil and plant biomass depict that several processes like chemical (redox, ion exchange, sorption, etc.), biological (assimilation of trace metals, bioremediation by microbes and flora) and physical (adsorption, coagulation, sedimentation) are taking place resulting the improved quality of wastewater. Values are shown in Table 1 below
| BOD | COD | Na | Al | K | V | Cr | Fe | Cu | As | Rb | Ba | Pb | |
| BOD Wastewater (from Canal) | 60 | 184 | 49 | 0.1466 | 4.46 | 0.0046 | 0.0076 | 0.1552 | 0.0077 | 0.0013 | 0.0076 | 0.0375 | 0.0031 |
| Wastewater (from Wetland) | 13 | 44 | 29 | 0.0143 | 0.8205 | 0.0033 | 0.0063 | 0.0736 | 0.0112 | 0.0006 | 0.0004 | 0.0291 | 0.0013 |
A considerable decrease in the concentrations of trace elements in wetland systems indicates the efficiency of wetlands in improving the quality of wastewater. Further, a conceptual model of flow and mass transport, and the hydrogeochemical model would be generated to establish the strategies for enhancement of constructed wetlands and other natural treatment systems to achieve the concept of sustainable water.
| Title | Assessment of ground water contamination in Bhongir Watershed, near Hyderabad |
|---|
Work Description:
The present study is aimed at identifying and understand the hydrogeochemistry of groundwater and its quality. The study area chosen is Bhongir watershed which is 48 km from the Hyderabad falls in Nalgonda District of Andhra Pradesh. A total of thirty eight groundwater samples were collected randomly covering the watershed and analyzed for important physicochemical parameters; pH, EC, TDS, Total hardness and major anions (chloride, carbonate, bicarbonate, phosphate, sulphate, nitrate, fluoride) and cations (sodium, chloride, fluoride, nitrate, phosphate). The pH and TDS of the collected water samples were digitally measured by using pH meter and TDS meter respectively. The carbonates and bicarbonates were determined by volumetric method. The major anions and cations were determined using Ion chromatography.
The analytical data of alkalis (Na+ and K+) and alkaline earths (Ca2+ and Mg2+), reveal that high concentration of Na+ than others ( Na>Ca>Mg> K ) is probability due to the loss of Ca2+ and Mg2+ and gain of Na+ by the cation exchange process. Among the anions, bicarbonate is identified in majority of the samples in the following order HCO3>Cl >SO4 which confirm that all carbonate minerals might have been dissolved and added to the groundwater system.
According to the WHO standards, 81% of the samples are exceeding electrical conductivity of the allowable limits for drinking. On the other hand, results demonstrated that the groundwater of the area represent brackish water (84% of samples) in accordance with Freeze and Cherry classification.
The highest concentration of nitrate (e.g.565.69 mg/L) in most of the samples (53%) indicating excess usage of fertilizers in the study area. Further, the elevated concentrations of fluoride (i.e. maximum 4.1 mg/L) in most of the water samples (66%) reveal there is a possible source from geological factors as per the reported literature than anthropogenic influence (Fig 10.1 and 10.2)
As many of the parameters like hardness, electrical conductivity, sodium, nitrate and fluoride are above the permissible limit, the ground water of the study area is unfit for consumption for drinking. Therefore, suitable remedial measures are needed in order to protect the human health.
( K. Rama Mohan, V. Periasamy, Swetha Ramesh, S.Srinivas Rao)
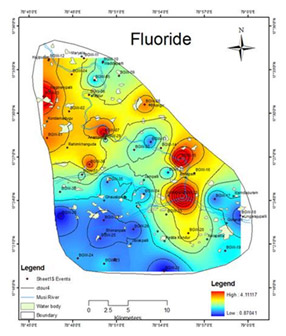
Fig.10.1:
Spatial distribution of Fluoride (mg/L) in ground water

Fig.10.2:
Dental Fluorisis in the people of the study area
| Title | Setting up of Rock Eval 6 Pyrolysis system |
|---|---|
| Participants | D. J. Patil, M.S. Kalpana , Devleena Mani, T. Madhavi, S. Kavitha, A M Dayal |
| Sponsoring Agency | Oil Industries Development Board |
Work Description:
Gas potentiality of the Proterozoic and Phanerozoic shales from the NW Himalaya, India: Inferences from new pyrolysis data
Information on the organic richness and kerogen properties of the shales from the North Western Himalayan region of India has been carried out for the evaluation of their gas generation potential. About seventy Proterozoic and Phanerozoic shales were sampled from the outcrops and underground mines of Jammu, Kashmir and Ladakh regions of Indian Himalaya (Fig11.1). The studied areas include the Cenozoic Foothills belt of Jammu and Intermontane basin of Kashmir which lie in the Outer Himalaya, the Zanskar basin that forms part of the Tethyan Himalaya, and the Ladakh and the Karakoram zones, containing Mesozoic-Tertiary shale forming part of the Trans Himalaya.
Ranging in age from Proterozoic to Tertiary, the organic matter characteristics of the carbonaceous and coaly shale rocks vary widely and exhibit significant controls of the sedimentary and burial history on the preservation and maturation of the organic component in rocks. The Upper Palaeocene to Eocene Subathu Group shales from the Jammu Foot Hill belts in the Outer Himalaya have high TOC content ranging (in wt. %) from 2% in carbonaceous shales to as high as 30% in coaly shales (Fig.11.2). These shales show S1 (thermally liberated free hydrocarbons) and S2 (hydrocarbons from cracking of kerogen) values between 0.1-2.6 mgHC/gRock (milligram hydrocarbon per gram of rock sample) and 0.5-15.5 mgHC/gRock,respectively. The Tmax (temperature at highest yield of S2) ranges between 490-515°C, suggesting a post mature stage for the hydrocarbon generation. The hydrogen index (HI) ranges between 10-113 mgHC/gTOC. The organic matter is characterized by gas prone Type III kerogen and fair to excellent source rock potential is exhibited by the Subathu shales.
The Interbedded shale units in the Proterozoic Sirban limestone Formation, which occurs as isolated inliers in Jammu, show a TOC nearing 1% with quite low HI values. The Plio-Pleistocene carbonaceous clays and lignites from Karewa Group are rich in organic matter with the TOC content up to 29.4%. The Tmax ranges between 399-427°C suggesting a mature phase for the hydrocarbons. The hydrogen index (HI) is comparatively high, ranging in values between 109-278 mgHC/gTOC. The shales from the Permian-Triassic boundary in Kashmir are lean in organic matter with TOC values of ≤1% whereas the Cretaceous shales from Ladakh show quite low TOC content of ≤0.5%. Majority of these shales from Tethys and Trans Himalayan region appear to have undergone organic metamorphism associated with the Himalayan orogeny.
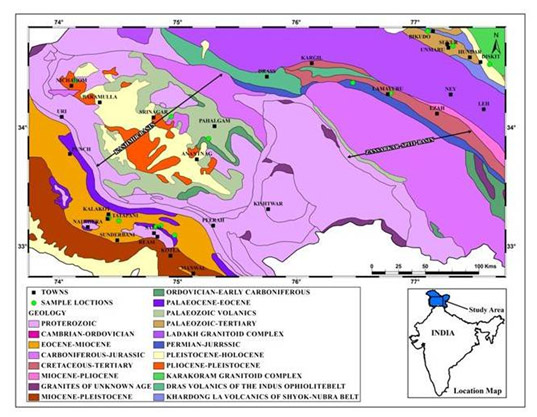
Fig.11.1:
Geological map of Western Himalaya (after GSI, 2013) showing shale sample locations
Fig.11.2:
Source rock characteristics as interpreted by the relationship between hydrocarbon potential (S2) and TOC (wt. %) for the Subathu samples from Jammu Region
| Title | Geochemical Soil Survey –Ruvu Block, Tanzania |
|---|---|
| Participants | D. J. Patil, A M Dayal, M.S. Kalpana ,T. Madhavi, Devleena Mani, M. Lakshmi, M. A. Rasheed, P.L.Srinivas Rao, S. Kavitha, N. Pundaree, P.V. Srinivasa Reddy, Snigdharani Mishra |
| Sponsoring Agency | Dodsal Hydrocarbon and Power (Tanzania) Pvt. Ltd. |
Work Description:
Dodsals Ruvu block covers the failed rift arm known as Ruvu Basin and a portion of the Dares-Salaam (DSM) platform that separates the Ruvu basin from the coast (Fig. 12.1). Ruvu basin was formed by rifting related to the break-up of Gondwanaland in the Permo-Triassic and Early Jurassic as a failed arm of a triple junction.The Ruvu Block has an area of 15,337.6 square kilometers. Dodsal signed a Production Sharing Agreement with the Tanzania Petroleum Development Corporation in 2007 for the exploration and production in this block.
A total of 469 soil samples were collected for adsorbed soil gas analysis from a depth of 2.0 to 3.0m in a grid pattern. Samples were collected around Kikoka, south of Kwalaza, south of Mlandizi, northeast of Mzenga, East of Masaki and north-south of Kisarawe from the block under study.
The concentration distribution pattern for C2+ shows high concentrations near Bagomoyo, Mlandizi and Kisarawe and small anomalous zones are also observed in the north east of Mlandizi (Fig12.2). Pixler plot also suggest that the hydrocarbons were derived from oil & gas condensate and gas windows Integrated geochemical studies involving adsorbed soil gas and carbon isotopes indicate the presence of micro-seepage of hydrocarbons from thermogenic source. Based on the anomaly map of C1, C2 and C3 the Simbo, Bagomoyo, Mlandizi and Kisarawe and scatter areas of the basin look promising for future hydrocarbon research and exploration.
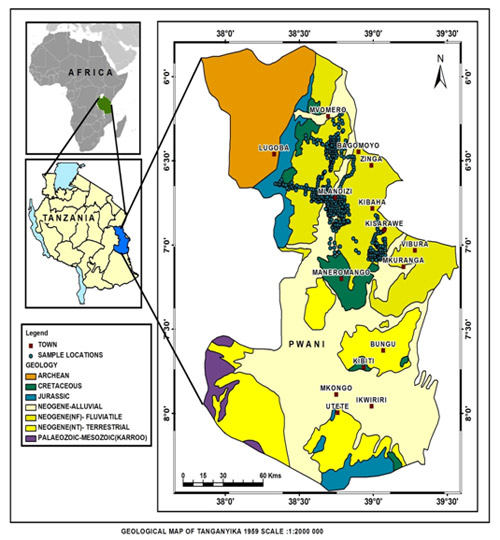
Fig.12.1:
Geological map of Tanganyika with sample locations, Ruvu Block
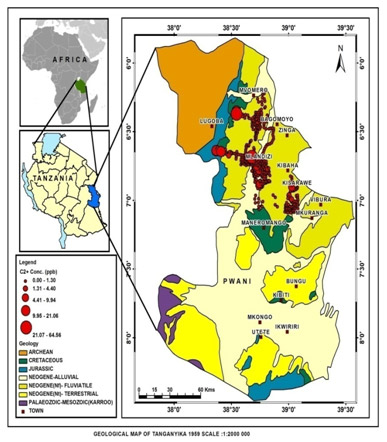
Fig.12.2:
C2+ concentration (wet gas components) of soil samples in Ruvu Block.:
| Title | On Geochemical survey for assessing gas seepage in Deohal area |
|---|---|
| Participants | D. J. Patil, A.M. Dayal, M.S. Kalpana, T. Madhavi, Devleena Mani, M. Lakshmi, M. A. Rasheed, P.L. Srinivas Rao, S. Kavitha, Snigdharani Mishra, N Pundaree |
| Sponsoring Agency | Oil India Limited |
Work Description:
Oil India Limited awarded a contract for geochemical survey for assessing the gas seepage in Deohal area from blowout well NHK # 285, using gas concentration, microbiology and isotopic signature on 14.12.1012. NHK#285 well was drilled in 1976 to target depth of 3913m within basement. It was the first exploration well on Deohal structure for probing hydrocarbon prospects. It was producing 20,000-30,000 SCMD of gas from 2427m Barail sand through 3.0m bean till July 2011. On 14th July 2011 a high intensity sound from the well was reported and gas leakage was observed at various places of the wellhead. Subsequently the well was abandoned. Basic objective of the study was to see the extent of spread of blowout gas around the well in an area of 70 sq km by studying the subsurface soil samples for light hydrocarbon concentration as well as the microbial study. A total of 208 soil core samples were collected around the blowout area. For the realization of above-mentioned objectives, the following work elements have been used:
Determination of concentration of light gaseous (Methane (C1), Ethane (C2), Propane (C3), i-Butane (iC4), n-Butane (nC4), i-Pentane (iC5) and n-Pentane (nC5)) hydrocarbons in soil samples using Gas chromatograph (GC).
Measurement of carbon isotopic ratio for TM13C in selected soil samples using Gas Chromatography-Combustion-Isotope Ratio Mass Spectrometer (GC-C-IRMS).
Microbial study of Propane and Ethane Oxidizing Bacteria (POB, EOB) in soil samples. Integration of Gas Chromatographic, Carbon isotopic and Microbial data sets to in order to delineate prospect regions.
The adsorbed soil gas analyses show presence of moderate to low concentrations of methane in the study area. Ethane, propane and butane have not been detected in any of the sample. The pattern of distribution of light hydrocarbon gases and microbial data in the study area shows low concentration as we move away from the well.
Ethane and propane were not detected in adsorbed gas analysis but EOB and POB were found in all the samples. The concentration map of POB indicates presence of higher values around the well and towards the south of the well. EOB also shows higher counts around the well, south of the well and northeast of well.
Integrated map of methane concentration, POB and EOB show higher concentrations around the well # 285, disperse higher concentrations towards north and south of well (Fig 13.1). These higher concentrations may be associated with some fault systems in the area.
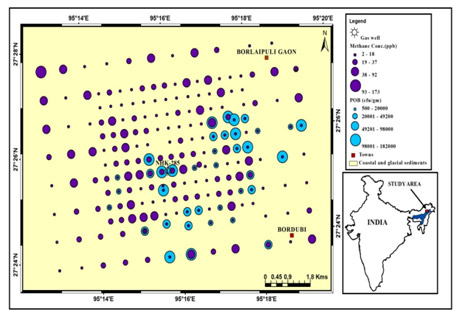
Fig.13.1:
POB anomaly map
| Title | Geochemical Surveys for Hydrocarbon Exploration in Spitti- Zanskar- Karewa basins |
|---|---|
| Participants | D. J. Patil, M. S. Kalpana, A. Uppaliah, M. A. Rasheed, N. Pundaree, Devleena Mani Tiwari, T. Madhavi, M. Lakshmi, P. L. Srinivas Rao, S. Kavitha, A. Uppalaiah and A. M. Dayal (Consultant) |
| Sponsoring Agency |
Work Description:
Surface geochemical studies were carried out in Spitti- Zanskar- Karewa basins in Jammu, Kashmir, and Ladakh areas (Fig.14.1 and 14.2). The total area of the state??? is about 12850 sq. Kms. Spitti valley is exposed between the central Himalaya and Zanskar range and contains the complete set of formations from Precambrian to the Cretaceous. The Lahaul‐Spitti basin is the south eastern extension of Zanskar basin and is part of larger Spitti‐Zanskar Tethyan basin. The rocks exposed in the area cover almost entire Phanerozoic span. These rocks are affected by numerous faults and shears; the Lingti, Syarma and Spitti and Kauirik faults are prominent. The Lahaul‐Spitti and Kinnaur areas fall under Tethys Himalayan Tectogen, which is separated by Lesser Himalaya Tectogen by MCT, a major tectonic zone. Zanskar basin is northerly branch of the Himalayas lying between the Ladakh range on the north and Great Himalaya on the south. A complete sequence of marine sedimentary rocks occurring north of the Great Himalayan Range and ranging in age from Precambrian to Tertiary is reported by the previous workers. The Karewa deposits of fluvial, lacustrine and aeolin origins were initially deposited in large lakes. The Karewa group includes the entire succession of the sedimentary cover of Pliocene to Holocene age, lying over the Precambrian and Mesozoic with unconformity. The total thickness of Karewa succession is about 1300 m. Based on the anomaly map of C1, C2, C3 the regions of Srinagar, Anantnag, Kalakot, Jammu, Shimla and Kalka, Rajgarh in Karewa, and Spitti basin look promising for future hydrocarbon research and exploration.
Concentration distribution of C1, C2, and C3 shows high concentrations for these gases near Ney Nimmoo, Kargil, south of Leh and centre of the basin.
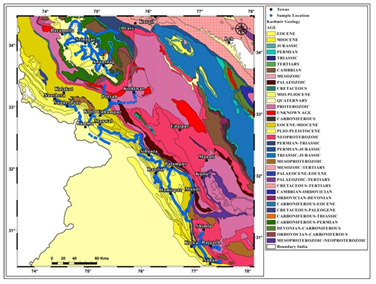
Fig.14.1:
Geological map of Jammu & Kashmir showing sampling locations
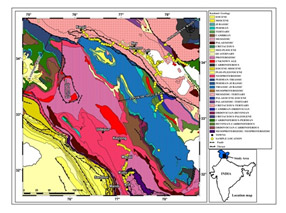
Fig.14.2:
Geological map of Ladakh region showing sampling locations
| Title | Gravity & Magnetic Studies for Delineation of Structural Features in Mizoram |
|---|---|
| Participants | BijendraSingh, M.R.K.P.Rao,D.Ch.V.Raju,V.Vijaya Kumar, Niraj Kumar, B.Nageswararao, Ch.Swarnapriya, S. Purushotham |
| Sponsoring Agency | Oil India Limited, Duliajan, Assam |
Work Description:
Gravity and magnetic (G-M) surveys were carried out covering an area of about 7000 km2 in the Mizoram state over a part of Arakan-Yoma mountain fold belt to delineate the subsurface shallow structural features for hydrocarbon exploration. Bouguer anomaly map of the study area shows predominance of long wavelength regional component which decreases from west to east. In general, long wavelength Bouguer anomaly shows inverse correlation with regional topography of mountain fold belt of Mizoram suggesting isostatic compensation of excess topographic load created due to convergence of Indian plate below the Burmese plate.
The residual gravity anomalies obtained after removal of regional component reveal north-south trending highs and lows resulting from folding of shallow sedimentary strata which reflect anticlines and synclines formed due to compressional tectonics due to the convergence of Indian plate with the Burmese plate. Residual magnetic anomalies also depict N-S trending highs and lows with a significant high in the centre of the area. Since the sediments are usually considered as nonmagnetic, the anomalies were attributed to shallow magnetic sources due to presence of magnetization in the Bhuban strata. Presence of magnetic minerals in Bhuban rock samples supports the above contention. Fig15.2 shows the structural features/faults derived from horizontal gradient of gravity map coincide with the flanks of synclines and anticlines which are mostly aligned in the N-S direction.
2½ D joint modeling of G-M anomalies along selected profiles was performed using constraints from available seismic reflection results. Fig.15.3 shows a six layer section comprising of upper, middle and lower Bhuban, Renji and Jenam, Laisong and Disang overlying the basement reveals number of anticlines and synclines within the sediment while the basement is a dipping interface with depth varying from about 8.0 km in the NW to about 12.0 km in the south and east.
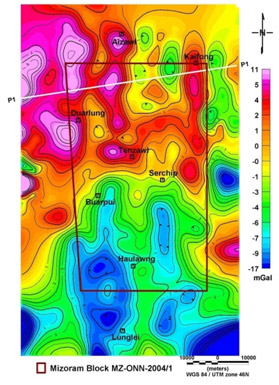
Fig.15.1:
Residual gravity anomaly map of the study area. Profiles 1-8 shown along which joint G-M modeling has been performed using constrained from seismic results.
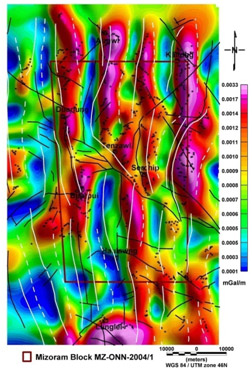
Fig.15.2:
Horizontal gradient map of CBA. It shows alternate maxima and minima associated with the flanks and synclines respectively. Superposed on this trend is plotted surface expression of anticlines (continuous lines), synclines(broken lines) and faults (black continuous lines)
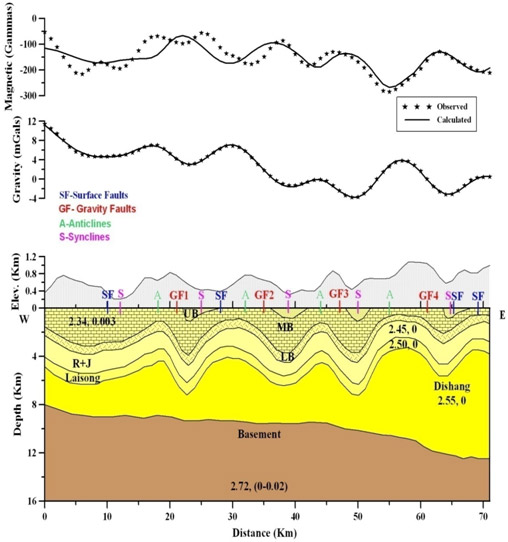
Fig.15.3:
Geological section derived from modeling of gravity and magnetic anomalies along profile. It depicts folded structure in the sedimentary section and dipping basement towards the east.
| Title | Stability of Coal Mines |
|---|---|
| Participants | Bijendra Singh, A.P.singh, B.Nageswara rao, S. Purushotham |
| Sponsoring Agency | Mahanadi Coal Field |
Work Description:
To monitor the progress of the sand front stowed into the cavities/galleries in the abandoned mine at Deulbera colliery, Talcher, Orisa, repeat micro gravity observations (Time lapse) were taken up in collaboration with CSIR-CIMFR and Mahanadi coal field limited (MCL).
Till now, five campaigns of repeat gravity observations have been carried out at every six month interval spread over a time period of three years. Progress of sand stowing work was assessed by taking the difference of gravity observations of various campaigns. The difference in micro gravity readings between the last and the first set (Set-5 and Set-1) shows predominantly positive values indicating addition of mass in the ground, but slightly low values in the centre around sand filling bore holes suggesting further need of stowing to be carried out in this region.
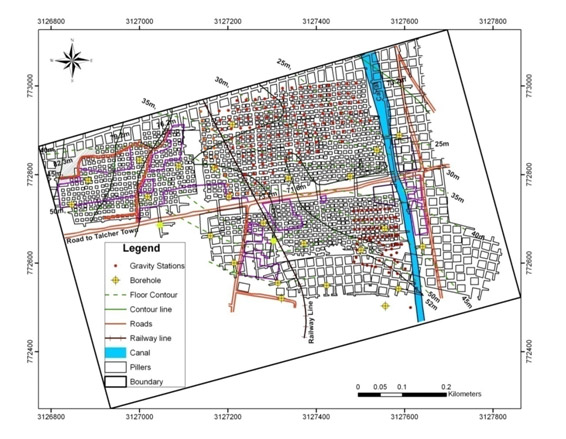
Fig.16.1:
shows the location of Ro mine near Talchir town.
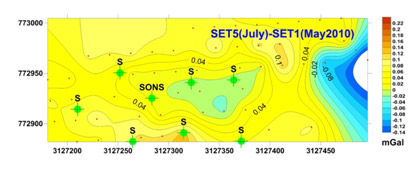
Fig.16.2:
shows the difference in micro gravity readings between the last and the first set
(Set-5 and Set-1)
| Title | Ground geophysical survey in Lower Vellar Basin, Cuddalore district, Tamil Nadu |
|---|---|
| Participants | R. Rangarajan, P. Srinivasa Rao, Murali Krishna, Veerababu, . Subash Chandra, . Shakeel Ahmad, D. D. Muralidharan |
| Sponsoring Agency | World bank, CGWB-MOWR, GOI |
Work Description:
Ground geophysical investigations comprising Vertical Electrical Sounding (VES), Electrical Resistivity Tomography (ERT) and Ground Time Domain Electromagnetic (G-TEM) were carried out at selected sites over the basin area with the main objective of distinguishing and delineating different aquifer stages up to the depth of 300 m. The present study distinguished geo-electrically different stages of three confined aquifer system to the depth beyond 300 m. The interpreted results of 24 VES were utilized to prepare isopach maps of the three confined aquifer system. Fig. 17.2 shows depth to top confined aquifer system.. Significantly, the images reflected a geological structure trending in NNW-SSE adjacent to the eastern limit of lignite boundary which may be significant in terms of hydrogeological conditions of confined aquifers further east. This feature probably retards an eastward migration of cone of depression by the continuous depressurization of confined aquifer for safe lignite mining at NLC lignite field.
The geo electrical cross section enabled in understanding the vertical and lateral extensions of main confined aquifers up to a depth beyond 300 m over the study area. The fence diagram (Fig. 17.3) brought out the aquifer disposition three dimensionally. The response of electrical soundings helped in demarcating the effective recharge area. Structural features were inferred within the study area and along the boundary for further studies
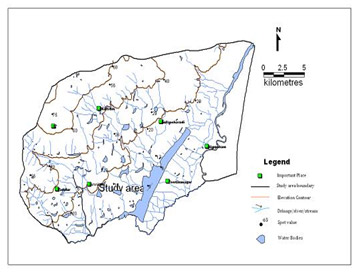
Fig.17.1:
Lower Vellar basin, Cuddalore district, Tamil Nadu
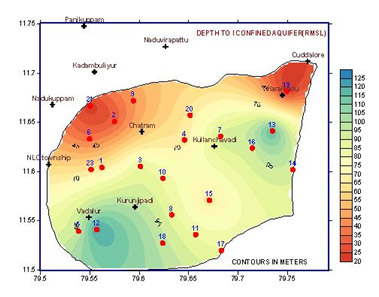
Fig.17.2:
Depth (m amsl) to first confined aquifer based on VES
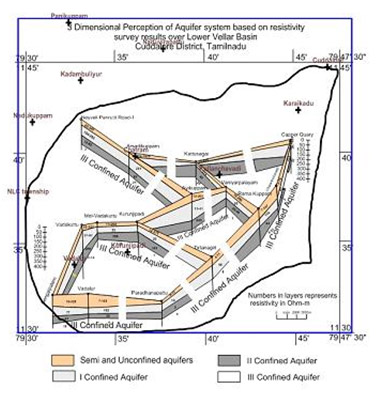
Fig.17.3:
3 dimensional aquifer disposition of lower Vellar basin
| Title | ETAS modeling of seismicity in Andaman -Sumatra region and NE Himalaya |
|---|---|
| Participants | Abhey Ram Bansal and Ashutosh Chamoli |
| Sponsoring Agency | CSIR, New Delhi |
Work Description:
The epidemic type aftershock sequence (ETAS) model is found suitable for analyzing the seismicity without removing the aftershocks. In this model, seismic quiescence and activation are based on the deviation from the rate of seismicity predicted by the stationary ETAS model. The non-stationary ETAS models associated with change-points in its parameters have been associated both with main shocks and large aftershocks in some individual case studies. We studied temporal changes in seismicity in Sumatra-Andaman Islands region before the M 9.1 earthquake of December 26, 2004 using ETAS model (Figure 18.1). Here we compared the NEIC magnitude (mb) with the ISC (International Seismological Centre) magnitude (Mb) for identical earthquakes in the Sumatra- Andaman Islands region (Figure 18.2 a). It is known that there is a systematic difference in magnitudes between the two catalogues, but we are concerned with the fact whether such differences are time dependent or not. From Figure 2a, we can see a transient magnitude shift around 1996 but we cannot clearly say either NEIC or ISC have magnitude shift. To establish a change in one of the catalogues as to, a third catalogue is required. In the Sumatra region, we do not have any third catalogue to investigate the magnitude shift. Therefore, we choose the Japan region as an analogue, where the earthquake magnitudes are given by catalogues of NEIC, ISC and the Japan Meteorological Agency (JMA). The difference in magnitudes of NEIC and ISC catalogues show same magnitude shift in Japan region (Figure 18.2b) and a similar shift in magnitude can also be seen in ISC and JMA catalogue (21.22c) whereas magnitude difference in NEIC and JMA catalogue does not show such a magnitude shift (18.2d). The JMA catalogue is very homogeneous throughout the time period. The two-stage non-stationary ETAS model with a single change-point provides a better statistical fit to the seismicity data than the stationary ETAS model throughout the whole period since January 1973 (Figure 18.3). We made further change-point analysis of datasets by dividing into two sub-regions. The best fitted models suggest that the seismic activation relative to the ETAS rates started in the middle of July 2000 (about 4.5 years before the M9.1 earthquake). This includes an increase in the background seismicity rates, particularly in the southern part of the seismogenic zone near the epicenter. A space-time ETAS model also suggests that the background seismicity throughout the entire Sumatra-Andaman Islands area had increased after the change-point time.
In another case study, we analyzed the seismicity of northeastern Himalayan region of latitude (25 to 32°N) and longitude (86–97°E). The NEIC catalogue is used in this study for a period from 1973 to June 2011. The seismicity of the region is modelled using epidemic type aftershock sequence (ETAS) model. The region is divided in three parts: (1) whole region, (2) subregion I, and (3) subregion II. The magnitude of completeness is found to be 4.6 for all the three regions. The ETAS parameters for all the regions are found same within the standard errors. There is no significant change observed in the seismicity since 1973 (Journal of Sesimology, 2013).
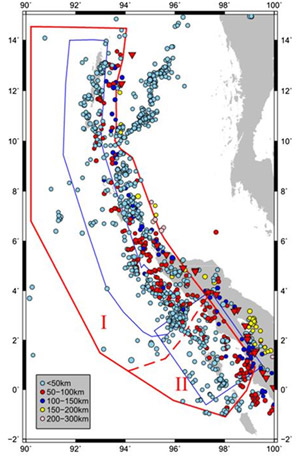
Fig.18.1:
The epicentral distribution of the earthquakes (m≥ 4.7) in the Sumatran region. The red polygon denotes selection of the region for the ETAS modelling. The region is further divided into two sub-regions I and II by the dotted red segment. The slip distribution of 2004 and 2005 is shown as blue polygons (http://www.tectonics.caltech.edu/slip_history/index.html).
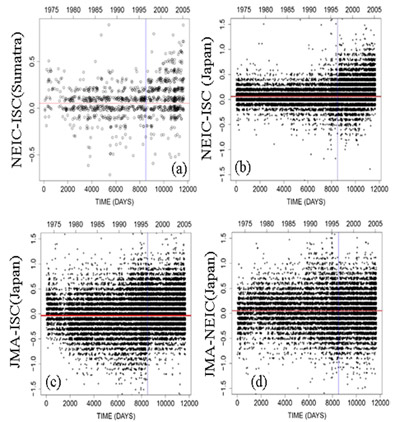
Fig.18.2:
Time series of magnitude differences between NEIC (mb), ISC (Mb), and JMA (MJ) catalogs for the same earthquakes: (a) mb-Mb for the Sumatra region, (b) mb-Mb for the Japan region, (c) MJ-Mb for Japan region, and (d) MJ-mb for the Japan region. The horizontal red lines are mean differences during the earlier period till 8500 days. The vertical lines correspond to the time of the possible magnitude shift.
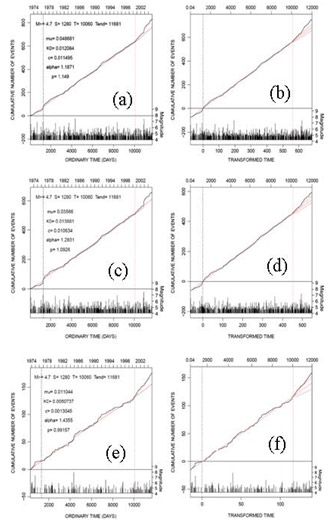
Fig.18.3:
Top panels show the estimated cumulative curves of the ETAS model to the data from the whole region for the period up to the MLE for change-point (red vertical dashed line) and the extrapolated ones to the rest of the period, against (a) ordinary time and (b) the transformed time. The 95% confidence parabola is shown in (b). The middle (c, d) and bottom (e, f) panels are for the data from sub-region I and II (see Figure 19.1), respectively; these are the same as the top panels except that the change-points are set to the same change-point as the MLE for the whole region data.
| Title | Assessment of Seismic Hazard in the Himalayan foreland basin |
|---|---|
| Participants | R K Chadha, D.Srinagesh, D V Ramana, M.Shekar, .Narendra Kumar and .A.P.Shankar |
| Sponsoring Agency | CSIR-NGRI |
Work Description:
A network of 24 strong motion velocity meters was installed in the foothills of Himalaya during October-November 2012 covering the western Indo-Gangetic plains in addition to the earlier array of broadband seismic stations (Fig.19.1). Indo-Gangetic plains are subjected to strong ground motions due to large earthquakes in the Himalaya because of thick pile of sediments in the region. Amplification of seismic waves at a soft site is often estimated from simultaneous recordings of ground motion, preferably due to earthquakes, at the site of interest and a nearby hard site, which is taken as a reference site. The amplification is given by the ratio of the Fourier amplitude spectrum of the ground motion at the site of interest to the spectrum of motion recorded on the reference site. This approach is called the standard spectral ratio (SSR) technique. Thus, if the ground motion of a future earthquake can be estimated at the reference site, then it can also be estimated at the site of interest from the known SSR.
Using recordings of four shallow focus earthquakes (M<5.0) which occurred in the Himalaya and near Delhi at soft sites and hard reference sites, we computed standard spectral ratios (SSRs). SSRs at sites near the Himalayan foothills with a sediment thickness of ~4 km, reveal a broadband amplification with a fundamental frequency of 0.13 Hz. The amplification at this frequency varies between 20 and 60. The fundamental frequency increases to the south as the thickness of the sediments decreases, becoming ~0:8 Hz at the southernmost site. The amplification at the fundamental frequencies exceeds 10 at all eight soft sites. Calculations based on reasonable earthquake source and attenuation models and application of random vibration theory suggest that peak ground acceleration and peak ground velocity at soft sites near the foothills, located 100 km from the epicenter, would be amplified by a factor of 2–4 and 6–12, respectively (Fig.19.2).
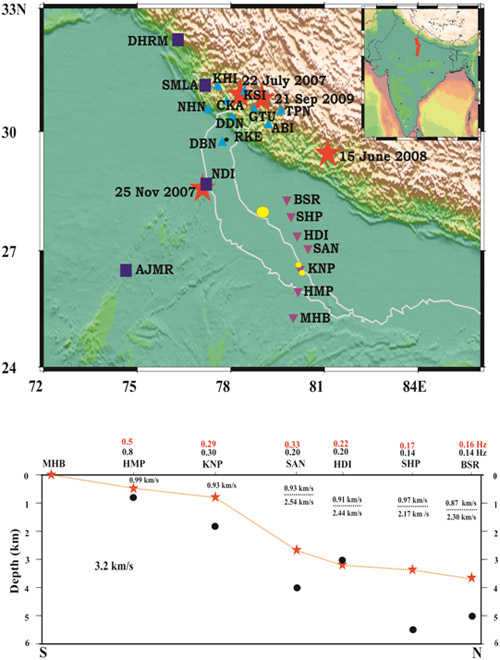
Fig.19.1:
(a) Stars are epicenters of the earthquakes; inverted triangles, the National Geophysical Research Institute array deployed to study amplification; triangles, Wadia Institute of Himalayan Geology permanent stations; squares, India Meteorological Department permanent stations. RKE is operated by Indian Institute of Technology, Roorkee. Stations NDI, AJMR, and MHB are in the Indian shield. Yellow dots show borehole locations: black dot, basement depth (b) Upper crustal structure below individual stations, as retrieved from receiver–function modelling (red stars). Shear-wave velocity of the basement is fixed to 3:2 kms. For the two-layer case (below SAN, HDI, SHP, and BSR), the dotted line indicates the depth of the interface. Numbers below the stations give shear-wave velocities. The depths of the basement (black dots) are from earlier work by other researchers. Numbers above station names in black and red are observed and computed fundamental frequencies.
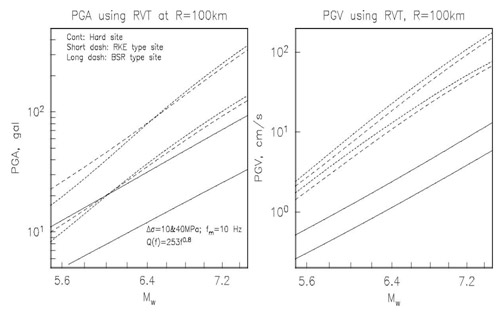
Fig.19.2:
(a) Predicted PGA as a function of Mw at a hard site and sites characterized by the SSR of RKE and BSR. R -100 km. The predictions are based on the Brune ω2-source model, assuming stress drops of 10 and 40 MPa and application of random vibration theory.
| Title | Geomagnetic observatories to monitor changes of magnetic field and related hazards |
|---|---|
| Participants | Kusumita Arora, S.R.Sannasi, K.C.S Rao, L.Manjula, C.H.Gattaih |
| Sponsoring Agency | CSIR-NGRI |
Work Description:
The IMO-HYB of CSIR-NGRI has been recording the changes of the geomagnetic field since 1964. The long term changes are indicators of internal (within the Earth) and external (primarily solar) alterations of the Earth’s core and the solar environment respectively. Studies of such alterations contribute to knowledge about the silent hazards in the magnetic environment. With increased industrialization of Hyderabad and the Hyderabad Metro Rail Project, the IMO-HYB has experienced some degradation of electromagnetic environment. Initial heavy engineering activity of Metro Rail is currently underway, about 1 km from the HYB sensor rooms. A planned re-location of the IMO-HYB to the campus of NGRI Earth Current Observatory (CPL), Choutuppal, is ongoing. Choutuppal Geo-electric Observatory was sited on carefully selected area of 100 acres set in the farmland 6 km north of Choutuppal town on the eastward Hyderabad-Vijayawada Highway, which had originally housed the induction coil and calibration setup. The geology of this area consists of crystalline granite-gneiss covered with a thin layer of soil. Resistivity, self-potential and magnetic surveys were carried out over the site and the uniformity of rock outcrop been determined. The granite is highly resistive ~100,000 ohm.m. It has been established from magnetic and MT measurements over the last thirty years that the CPL campus is a magnetically homogeneous and low noise environment.
Within this campus, an optimal location for the present magnetic measurements has been chosen. During the latter part of 2011 and early 2012, a magnetic survey was carried out and the re-location efforts of the magnetometers have been started (Fig 20.1). This includes pillar/shelter construction for variometers, Proton Precession Magnetometers and absolute magnetometers. 3-component variation and absolute measurements using a digital fluxgate magnetometer were commenced in May 2012, in a temperature controlled environment. Variations and absolute measurements are being carried out on a regular schedule since May 2012. Comparison with records from IMO-HYB is ongoing (Fig. 20.2). To complete the re-location, Observatory grade infrastructure and instrumentation installation are being commissioned.
Location of Choutuppal Observatory:
| Latitude | Longitude | |
|---|---|---|
| Geographic coordinates | 170 17' 45" N | 780 55' 33" E |
| Geomagnetic coordinates | 070 28' 20" N | 1490 14' 18" E |
| Elevation above msl | 350m (approx.) |
Based on continuous recording of earth currents, the electrical noise was judged to acceptable till 1990, mainly due to lack of development of the surrounding farmland. The induction coil and earth current systems at CPL used galvanometers with optical amplification to record variations. By 1990, the advent of borewells to pump out groundwater in neighbouring farms created disturbances to earth currents (>1 Hz) due to the highly resistive terrain and further, elements of the recording system became obsolete.
Pi2 pulsations recorded at low latitudes are regarded to be one of the clearest indicators of magnetospheric sub-storm onsets and intensifications; consequently, they can play an important role in space weather forecasting. Pc3 pulsations can be used as a diagnostic for determining plasma density along geomagnetic field lines and have recently been demonstrated to be a means of tracking the temporal variations of the plasma-pause. Magnetic pulsations that occur during each phase of a storm are indicative of energy transport mechanisms at the magnetosphere boundary (~50,000 km) above the Earth’s surface. Magnetic pulsations are observed as both magnetic and electric variations, on the ground and in space. These hydromagnetic waves are recorded at the Earth’s surface in limited frequency bands as magnetic pulsations. At low-latitudes, the input of energy during magnetic disturbances, also affects the ionosphere over time-scale of hours. Thus, the monitoring of low-latitude pulsations as indicators of energy inputs into the ionosphere has been mooted.
Continuous earth current measurements commenced in 1967 and induction coil measurements of magnetic pulsations in 1969.The quick run (QR) set-up having constant recording speed of 90mm/hr records the pulsations in the period range 30-600 sec, while the ultra-quick-run (UQR) set-up with speed of 30mm/min can record pulsations in the period range 0.5- 40 sec. The pulsation activity associated with SC magnetic storms (20 such storm from the year 1980) have been tabulated and examined. In order to examine the relationship between types of pulsations in closer detail, spectral analysis and wavelet analysis on selected segments of pulsation records.
Weekly average occurrences of Pc3, Pc4, for the years 1974-1983 have been compared to occurrence of Bz, By, interplanetary parameters (Fig 20.3a) below. The yellow plot denotes Pc3 occurrence. It is seen that Pc3 occurrences are more than Pc4 especially in 1974, 1981, and 1983. The effects of B variation can be seen more strongly in pulsations associated with disturbance magnetic field (Pc5, Pi2).
The wavelet spectrum of a digitized ultra quick run chart of Feb 7, 1980 shows the bands mostly ranging in periods between 10sec to 20 sec, i.e. this is mixed Pc2 and Pc3 signal. Progression into Pc3 is clearly demonstrated in the above example between 450-500 sec intervals, where the period of signal clearly increases steadily from 10 to 15 seconds. The amplitude of Pc3 is reduced as seen from the power spectral plot, but the presence of both signals is evident from the vertical signatures in the wavelet. Pc2 type pulsations are more frequent in the UQR charts. The separation of such pulsations is not easy by visual inspection. However, the differing spectral content separated in time or occurring simultaneously is clearly indicated in the wavelet transform
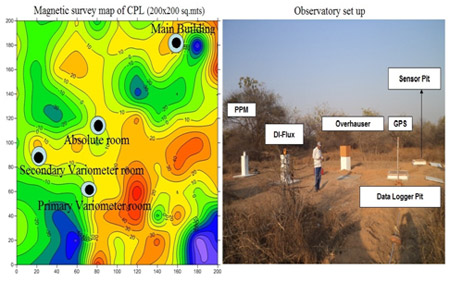
Fig.20.1:
Magnetic survey map and the observatory set up at CPL.
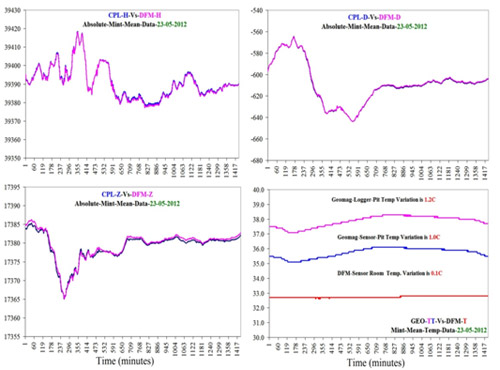
Fig.20.2:
Comparision plots of H,D, Z and T components between CPL and HYB.
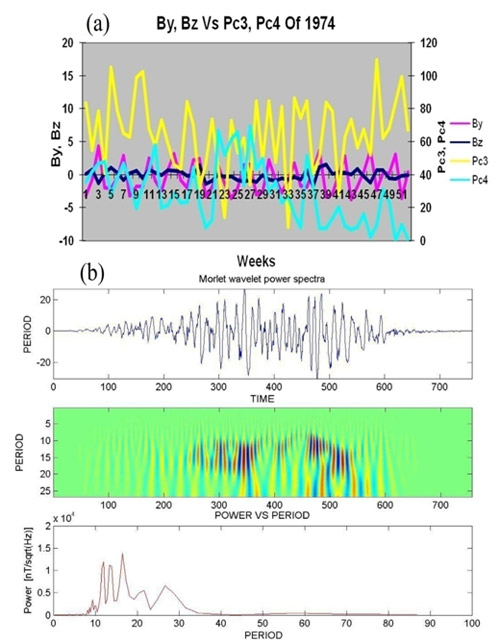
Fig.20.3a:
Plot of weekly averages of Pc3, Pc4 (CPL) with Bz, By (Interplanetary magnetic field) for the years 1974-1983. 23.(3b).Power spectral density and wavelet transform plot of a digitised segment of UQR pulsation chart of Feb 7, 1980.
| Title | Development of mathematical approaches for modelling of multi-parametric geophysical responses. |
|---|---|
| Participants | Abhey Ram Bansal, Ashutosh Chamoli and Avadesh Kumar |
| Sponsoring Agency |
Work Description:
We started our analysis by computer coding of synthetic gravity anomalies due to simple bodies such as sphere, prism etc. These anomalies will be useful to test the future methodologies of source identification at shallow subsurface. One of the methods of source identification is using wavelet transform. In this method, Poisson group of wavelets are used to characterize the geometry of the sources. The use of Poisson wavelets acts as an upward continuation operator combined with advantages of derivatives of the field. The homogeneous sources give cone like pattern due to scaling behaviour in the wavelet coefficients at different scales. In Figure21.1, a synthetic gravity data is presented and interpreted using wavelet transform (Figure 21.2). Here, we used a real Poisson wavelet of order 2. The characteristic cone like behaviour can be seen in the Figure 21.1 for two spherical sources. The location and centre of the spheres are derived from the intersection of the modulus maxima lines. In this case, the locations of the sources are identified accurately and the centre of the sphere is also delineated in good accuracy. The results show that the method is a good technique for the characterization of isolated sources of spherical shapes.
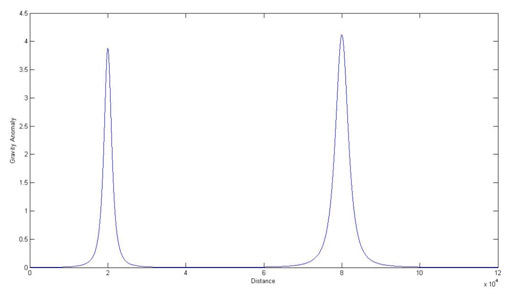
Fig.21.1:
Synthetic gravity anomaly due to two spheres at a depth of 15, 25 units.
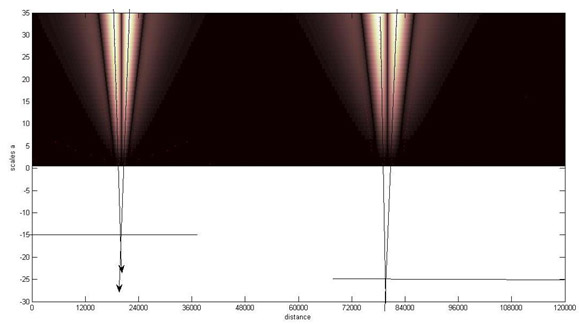
Fig.21.2:
Wavelet analysis of two spheres at a depth of 15 and 25 units.
| Title | Development of methodologies for imaging sub/intra basalt structures for prospect hunt in western India and its adjoining offshore regions |
|---|---|
| Participants | N. Satyavani, M.K. Sen, M. Ojha & K. Sain |
| Sponsoring Agency | CSIR-NGRI |
Work Description:
A. Georesource Exploration:
Half of the global oil is found in Mesozoic sediments. However in India, a vast tract of Mesozoics is hidden below the volcanics that make the routine geophysical methods incapable of probing them. For example, the standard reflection profiling often fails to image such sediments due to contamination of near-vertical primary waves with multiples, mode conversion and scattering waves caused by interbeds, brecciation and vesicles within the volcanics. The effect of these noises becomes less prominent as the source-receiver offset increases, and the primaries carrying sub-surface information stand out at the wide-angle range. The wide-angle seismic experiment that includes both the first arrivals and wide-angle reflected phases has been a proven tool to derive velocity structure in sub-volcanic provinces (Sain and Kaila, 1996; Sain et al., 2002a, b).
I. Imaging sub-basalt Mesozoics along the Jakhau-Mandvi and Mandvi-Mundra profiles from inversion of wide-angle seismic data in Kutch sedimentary basin, western India
From traveltime inversion of first arrivals and wide-angle reflections corresponding to eight shots with ~10 km interval and 100 m geophone intervals spread over 80-km long Jakhau-Mandvi profile, we derived a five-layered velocity model with average interval velocities of 2.0, 4.6, 3.2, 5.2, and 3.5 km/s, respectively above the granitic basement (5.9 km/s). Likewise, we derived a four-layered velocity model with average interval velocities of 2.0, 4.65, 3.1, and 5.2 km/s, respectively above the basement (5.95 km/s) from traveltime inversion of first arrivals and wide-angle reflections corresponding to six shots and geophones spread in the similar way over 60-km long Mandvi-Mundra profile. By comparing with the lotholog available at a nearby Suthri well of ONGC Limited, we delineate suggest that these velocity layers correspond to the Tertiary (2.0 km/s) sediments, Late Cretaceous Deccan volcanics (4.60 - 4.65 km/s), Early Cretaceous (Mesozoic) (3.1 - 3.2 km/s) sediments, Late Jurassic Limestone (5.15 - 5.30 km/s), and Early Jurassic (Mesozoic) (3.5 km/s) sediments above the Achaean basement (5.9 to 6.0 km/s). We observe that the Early Jurassic sediments, delineated along the Jakhau-Mandvi profile, are not traceable along the Mandvi-Mundra profile (Fig.22.1).
II. Tomographic imaging of sub-volcanic Mesozoics along Sinor-Valod profile in Deccan Syneclise
We have derived a shallow P-wave velocity structure from traveltime tomography of first arrival seismic data along 90-km long Sinor-Valod profile in the Deccan volcanic province. The result shows Quaternary and Tertiary (2.0 - 4.0 km/s) sediments, Deccan volcanic (5.0 - 5.5 km/s), sub- and intra-trappean Mesozoic (4.5-4.8 km/s) sediments above the basement (5.8 - 6.0 km/s down to a maximum depth of 5.0 km. Due to Late Cretaceous volcanism and outpouring of lava flows, this region is affected by numerous dyke intrusions and thick volcanics forming sills in presence of horst and graben structures due to deep basinal faults (Fig.22.2). The sub-volcanic Mesozoic sediments are expected to be hydrocarbon-bearing due to their wide extension and suitable trapping mechanism of volcanic sills.
III. A review on Shale Gas Prospect in India
India has a number of sedimentary basins with organic-rich shale from Proterozoic to Cenozoic age, which need to be explored by geo-scientific methods. The Cambay, Krishna-Godavari, Cauvery and Damodar valley are four major basins of shale gas reservoirs that have considerable thickness of shale formation, TOC (2 to 6 wt%) content, and thermal maturity with vitrinite reflectance (>1.0). The Vindhyan, Upper Assam, Pranhita-Godavari and Rajasthan basins also show good prospects of shale gas from TOC content, thermal maturity and measurable thickness point of view. Shale gas in India is estimated to be more than 500 TCF, which could be more with collection of additional reservoir information. The domestic use of shale gas is not too far, the Indian industries have taken positive strides towards its exploitation.
B. Computational Geophysics:
I. Seismic anisotropy using S-wave splitting in Mahanadi offshore basin
Multi-component seismic data can effectively capture the complete wave field since it records both the compressional and shear wave data. Generally, the shear wave gets splitted into fast and slow modes while propagating through an anisotropic medium and this property can be very effectively used in identify the planes of anisotropy. The S1 axis is identified by locating the zones of increased amplitude (maximum energy) implying the faster propagation, while the S2 axis is identified by locating the zones of minimum amplitude and slow propagation velocity. The ocean bottom seismic (OBS) data acquired in the Mahanadi offshore by NGRI in 2010 shows such splitting patterns (Fig.22.3.left) in the azimuthal gathers of OBS data, clearly isolating the fast (S1) and slow (S2) axes of propagation in the radial azimuthal gathers. Further, amplitude nulls and amplitude maxima are observed in the transverse azimuthal gathers. These two features are diagnostic for the existence and orientation of anisotropy which has been modeled by generating full waveform synthetic seismograms.
Based on studying 2-D multi-channel seismic (MCS) and the OBS data, we report that this splitting could be due to dominant fractures present in this region. The strike of this fracture set is inferred to be ∼130° from the S1 and S2 orientation and variation in the P-wave amplitude with azimuth (Fig.22.3.right). A good match between the synthetic and observed data is noticed for a near vertical fracture (dip angle of ~85°). The seismic image obtained from 2D high-resolution MCS data correlate reasonably with the OBS results. Based on these analyses, we are able to delineate the fracture zone, which is linked to near vertical fracture in gas hydrate reservoir.
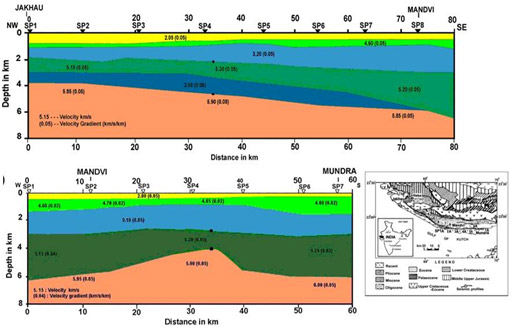
Fig.22.1:
Final velocity models along the Jakhau-Mandvi (top) and Mandvi-Mundra (bottom) profiles exhibiting Mesozoics (3.1-3.2 km/s) below Deccan volcanics (4.6-4.7 km/s). A second layer of Mesozoics (3.5 km/s), observed below the Limestone formation (5.15-5.3 km/s) along Jakhau-Mandvi profile, pinches out near Mundra and is not observed along the Mandvi-Mundra profile. Location of Profiles superimposed over the geological map of Kutch basin.
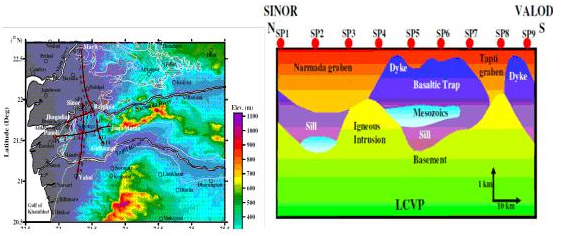
Fig.22.2:
of the profile superimposed over the geological map of the Deccan Syneclise (left).Schematic geological model showing the possibility of hydrocarbon accumulation in sub-volcanic or sub-basaltic Mesozoic sediments (right).
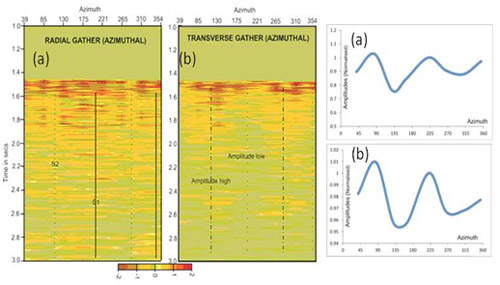
Fig.22.3:
Left - Fixed-offset radial (a) and transverse (b) gathers of OBS data. The fast (S1) and slow (S2) axes are very clearly noticed on the radial gather while the amplitude null and amplitude highs are distinctly observed on the transverse gathers, indicative of anisotropy. The variation in seismic amplitude for the vertical component (P-wave) as a function of azimuth plotted for observed (a) and synthetic (b) data for the OBS. A clear reduction in seismic amplitudes can be noticed at an azimuth of 130° in both the synthetic and observed data
| Title | Integrated Geophysical Techniques and Numerical Modelling of Geophysical dataset for mapping mineralization zones |
|---|---|
| Participants | Dewashish Kumar, D.V. Subba Rao and K. Sridhar |
| Sponsoring Agency | CSIR-NGRI |
Work Description:
This study is aimed at mapping the subsurface mineral deposits as well as their quantification using integrated geophysical exploration investigation employing electrical resistivity and induced polarization methods.
Work Carried Out
In the first phase of geological field work, 8 sites were identified in and around Betul district and surrounding in Madhya Pradesh, Central India for geophysical investigation. These sites are located in mafic-ultramafic complex and volcanic rocks. Both the disseminated, altered and massive sulphide mineralization is seen within the rock samples, which are exposed near the surface. In the 2nd phase of field work, Electrical Resistivity Tomography (ERT) and Time Domain Induced Polarization (TDIP) investigations were carried out at 5 identified and feasible sites (Fig.23.1) in the study area.
Data Acquisition and Analysis
Two dimensional electrical dataset was collected along a 3.8 km line in Betul-Chindwara belt (BCB) Madhya Pradesh, Central India both in resistivity and TDIP mode with 8 windows timing set up for IP measurements in order to capture all possible range of resistivity and variations in chargeability. The inverted 2D resistivity and chargeability sections are finally interpreted in terms of geological formations and especially in terms of mineralization. The dataset was interpreted in conjunction with the geological and structural information of the area. The results and findings of some of the important anomalous sites are presented and discussed here.
Padhar Site
The 2D profile passes through the Padhar village (220 03’1.9” N and 77050’42.3” E), Betul district. Geologically, this site consists of mafic-ultra mafic complex of high density rock along with iron oxide. There is a clear cut anomaly showing high chargeability of the order of 15-30 mV/ in the 2D apparent chargeability pseudo section (Fig 23.2). Two prominent anomalies are revealed at a depth of ~40m to >131m below the surface with chargeability value of ~30-40 mV/V and ~25-50 mV/V at 320m and 480m lateral distance respectively (fig.23.2a). These anomalies clearly indicate the presence of either the disseminated sulphide or the massive magnetite ore body extending both in lateral and vertical directions.
Pipariya Site
The chargeability 2D model inverted section at this site (Fig.23.3) is located at 21059’45.4” N and 78023’58.3” E with an elevation of 701m amsl. The near surface indicates the weathered rock materials. A gossan in the form of oxidized/altered mineralization are seen in the rock samples and cuttings. The model clearly shows the conductive anomaly right from 45m down to a depth of 74m both in lateral and vertical directions. The said anomaly varies in a smooth pattern and it ranges from 20 to 34 mV/V.
Discussion and Results
High chargeability ( 1.59 to 62.3 mV/V) is observed at 5 different sites up to a maximum depth of 131m. The basement topography is clearly mapped by the high resistivity values and its contrast while TDIP shows high chargeability values indicating signature of good conductor. The interpreted result at Padhar site shows that there is large conducting body at a depth of ~40m to >131m below the surface at 320m lateral distance and another conductor at a depth of ~35m at 480m distance of the profile extending up to 640m lateral distance. The present results and findings need test drilling at the anomalous site(s) to confirm the depth persistence as well as quantification of mineral resources.
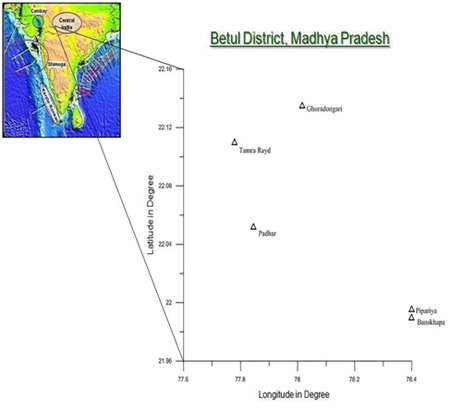
Fig.23.1:
Location map showing study area with village names where the electrical resistivity and TDIP investigation was carried out
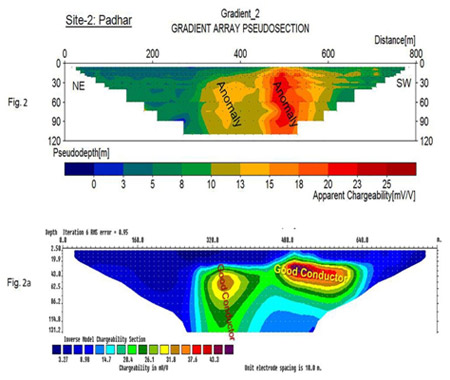
Fig.23.2:
Shows the 2D apparent chargeability section with two distinct anomaly and (2a) 2D inverted chargeability section with two clear cut 40m toconductive anomaly at a depth of >131m below the surface at Padhar site, Betul district, Madhya Pradesh
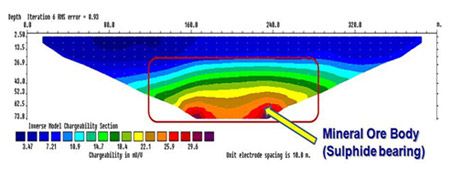
Fig.23.3:
Shows the 2D inverted chargeability section with smooth variation of the conductive anomaly from a depth of 45m at Pipariya site, Betul district, Madhya Pradesh
| Title | Study on influence of water saturation on rock thermal conductivity measurements |
|---|---|
| Participants | P. Nagaraju, G. Ravi, Sukanta Roy |
| Sponsoring Agency | CSIR-NGRI |
Work Description:
We studied the effect of water saturation on thermal conductivity measurements using a set of 67 rock samples covering igneous, sedimentary and metamorphic rocks. The rock samples range in porosity from 0 to 8 % (Fig.24. 1). Thermal conductivity measurements were carried out in the laboratory both in dry as well as water-saturated states using a steady state thermal conductivity meter. Thermal conductivities of rocks measured under both states are plotted for comparison (Fig.24.2). The present data reveal that for rocks with porosity >>1%, the thermal conductivity measured on dry rock is appreciably lower (generally up to 25%) than the value measured under saturated state. For rocks with porosity <1%, the differences in measured thermal conductivities in the dry state and saturated state are within the measurement uncertainty. We therefore recommend that the thermal conductivity on all rocks should be measured after saturating the rock samples with water to reflect near in-situ thermal conductivity.
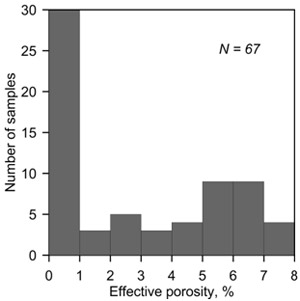
Fig.24.1:
Histogram showing the distribution of porosity for 67 rock samples of the present study. The sample set includes igneous, sedimentary and metamorphic rocks
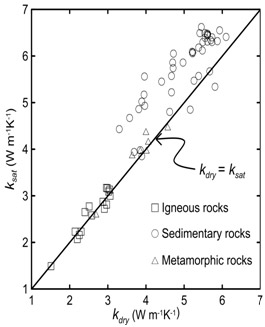
Fig.24.2:
Comparison of thermal conductivities measured under dry state (TC1) and wet state (TC2) for rock samples of the present study.
| Title | Application of new EM technique for near-surface imaging with application to sub-basalt imaging of central India and western offshore |
|---|---|
| Participants | Prasanta K. Patro, V. Suresh, Kasi Raju and Koteswara Rao |
| Sponsoring Agency | CSIR-NGRI |
Work Description:
We have identified South Rewa basin (Fig 25.1) in the central India as the study area for sub basalt imaging to carry out 2D seismic, MT, DRS studies. The upper Gondwana stratigraphy of the Rewa basin comprises of Triassic succession composed of a Pali formation followed by lower Gondwana formation such as Ranigunj, Barakar and Talchir formations successively. Depth to the granitic basement is nearly 4 km (taken from the stratigraphy sequence in the Tihki-1 well). Rewa basin is an intracratonic Gondwana basin formed along the Narmada Son Lineament zone filled with thick (~4 km) Gondwana sediments with intermittent volcanic intrusive. Synthetic studies were carried out with the limited information available in the literature to find out whether the different lithologies can be resolved using MT technique.
A forward model is created with the parameters shown in Fig 25.1. 2D MT responses were generated.2D forward modeling simulation was computed using finite difference equations generated by network analogs to Maxwell’s equations (Rodi and Mackie, 2001). A 2D mesh was created with 48 rows and 339 columns extending laterally and downwards beyond the area of interest. Fifty-one sites were created with a spacing of 3 km (see Fig 3 top). Synthetic MT data (TE and TM) was generated for the frequency range from 0.001 to 1000 seconds added with 5 percent random Gaussian noise. All the data for 51sites were inverted using the same model grid. Five percent error floor was assigned to the apparent resistivity and phase data (TE and TM). The inversion is allowed to run for 100 iterations. This inversion finds the regularized solutions using nonlinear conjugate gradients method (Rodi and Mackie, 2001). Obtained model after 100 iterations is presented in the Fig 25.2 bottom having a rms of 0.67.
| FORMATION | DEPTH (km) | RESISTIVITY (ohm.m) |
|---|---|---|
| PALI-THIKI | 0 - 1.3 | 50 |
| RANIGANJ | 1.3 - 2.5 | 50 |
| BARAKAR | 2.5 - 3.7 | 200 |
| TALCHIR | 3.7 - 4 | 300 |
| BASEMENT | 4 to 20 km | 5000 |
Table :Different formations along with their thickness taken from Tihki-1 Bore well (taken from Internet). Possible resistivities values are assigned to these layers for carrying out synthetic studies are listed in the third column.
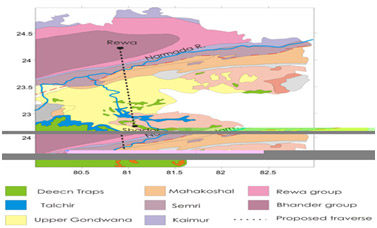
Fig.25.1:
Broad geology map of the study region. A profile from Rewa to Shadol is marked as broken line is the area of interest
Fig.25.2:
Top: Synthetic model for Rewa (to the west) -Shadol (to the east) profile. Narmada fault is incorporated to the model below sites RS 17 and 18. Bottom: Inverted model from the synthetic data generated from Top. Note that most part of the model is reproduced however the thickness of the Narmada fault is not resolved well, due to inadequate frequency (need to be tested further)
| Title | Mineralogy and Geochemistry of the Betul Layered Ultramafic-Mafic Intrusion, Central India: Implications on Proterozoic Mantle Evolution and Ni-Cu-PGE Metallogeny |
|---|---|
| Participants | D.V.Subba Rao, M.Sathyanarayanan, D.S.Sarma, A.Keshavakrishna and K.Venkateswarlu. |
| Sponsoring Agency | CSIR-NGRI |
Work Description:
Precambrian crust of Central India is divided into northern Bundelkhand craton and southern Bastar craton separated by Central Indian Tectonic Zone (CITZ). The Betul Layered Complex (BLC) emplaced into the Mesoproterozoic Betul supracrustal belt (1.5-0.85 Ga) occur in CITZ (Fig.26.1). In this study we present the geochemical characteristics of the mafic-ultramafic rocks with particular relevance to the nature of contemporaneous sub-continental lithospheric mantle and Ni-Cu-PGE mineralization. BLC is characterized by metamorphosed ultramafic-mafic rocks emplaced into Betul supracrustal belt consisting of bimodal volcanics and metasediments hosting VMS ores formed under a continental arc setting. The BLC exhibits primary mantle mineralogy (ol, opx, cpx, amp, phl) with secondary metamorphic mineral assemblages. Visible sulphide mineralization is noticed in the form of gossans and sheared and silicified horizons in Temra area in Western part of the BLC. Several exotic ore minerals and mineral phases such as native gold and sulphides of Cu, Fe, Ni, Pb, Rh, Rh-W, Zn-Fe and as well as tungsten bearing phases are identified in this suite using scanning electron microscope (SEM-EDS) (Fig.26.1). The whole-rock geochemistry of Temra rock samples shows high concentrations of Ni (317ppm to 1141ppm) and Cu (451ppm to 717ppm) and low platinum group element values. Palladium dominates over platinum. The electrical resistivity imaging/tomography survey at Temra has yielded a well defined anomaly and indicates a shallow depth persistence of the sulphide ores.
These Ultramafic-Mafic rocks are subalkaline tholeiites and record Fe enrichment and fractionation trends. High concentrations of Cr, Ni and Cu indicate the presence of accessory chromite and Ni-Cu sulphides. Compositional heterogeneity is noticed with enrichments of LILE and Pb, and depletion of Nb, Zr-Hf suggesting mantle wedge of these rocks has been metasomatically enriched with the fluids derived from subducting slab. SEM-EDS study on gabbros from BLC has revealed that they contain unusual native gold, Ni-Cu, Ni-Co, Fe-Cu sulphide and Fe-Ti-Si phase with platinum group mineral inclusions and are genetically related to the magmatic hydrothermal fluids (Fig.26.1). PGE geochemistry of these metagabbros from BLC is characterized by a high total PGE content of 1.2-1.5 ppm and have fractionated patterns (PPGE>IPGE; high Pd/Ir = 11 to 147) resembling the interstitial variety of sulphide type hosted in mantle xenoliths, as well as fractionated PGE patterns of basalt (Mondal, 2011). Preliminary data on the Total PGE abundances in the metaultramafic rocks of BLC are also high especially at Padar = 0.8 ppm, Bacha = 1.2 ppm and Bareta = 0.6 ppm. It is considered that the Mesoproterozoic period witnessed extensive ultramafic-mafic magmatism with orthomagmatic ores and existence of a long lived metasomatically enriched mantle source,VMS ores and convergent margin tectonic settings. The geochemical characteristics of the BLC rocks corroborates the above proposition.
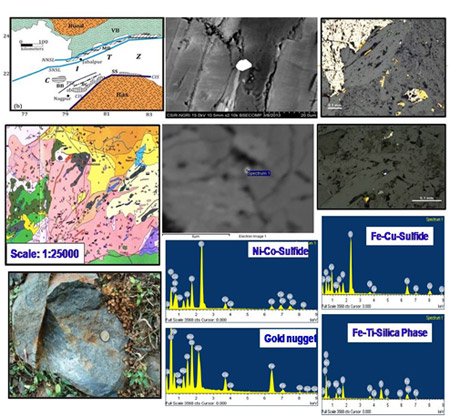
Fig.26.1:
Ni-Cu-PGE mineralization from Betul Layered Complex, CITZ, Central India
| Title | Exploration of shale gas in key sedimentary basins |
|---|---|
| Participants | M. S. Kalpana, D. J. Patil, A. M. Dayal,T. Madhavi, Devleena Mani, M. Lakshmi, S. Kavitha, N. Pundaree, Snigdharani Mishra |
| Sponsoring Agency | CSIR-NGRI |
Work Description:
Characterization of organic matter to evaluate the gas generating potential of shales from South Cambay basin
The petroliferous Cambay basin in western India with interbedded carbonaceous shales in its thick Tertiary sequence forms a potential shale gas prospect. Fine grained, clastic and organic-rich Cambay, Tarapur and other Tertiary shales have sourced the oil and gas for the basin. The Upper Paleocene to Lower Pliocene shale Formations have varied thickness from 50 to 70m over structural highs like Mehsana horst, Ankleshwar high and 500- 2000 m depressions in Hazira, Broach, Tankari, Tarapur and Patan, and can act as a source for the shale gas. About seventeen well preserved consolidated shale rock samples were collected from open cast lignite mines of Tadkeshwar and Rajpardi, Gujarat (Fig. 27.1) for Rock Eval VI pyrolysis analyses of shales to identify theorganic richness, kerogen type, maturity and hydrocarbon potential.
The Total Organic Carbon (TOC) content from Rajapardi shales ranges between 9.35- 26.03%. The S1 (thermally liberated free hydrocarbons) values range between 3.29–7.12 mgHC/gRock (milligram hydrocarbon per gram of rock sample). The S2 (hydrocarbons from cracking of kerogen) values show an elevated range between 60.6 -190.11 mgHC/gRock. The Tmax (temperature at highest yield of S2) ranges between 429-435°C. The hydrogen index (HI) is high ranging in values between 648-754 mgHC/gTOC, where as the oxygen index (OI) for all studied samples is near to 15. For the Tadkeshwar shales, the TOC varies between 0.19 to 47.39 %. The S1 values are between 0.05 to 3.58 mgHC/gRock and the S2 values range between 0.14 to 68.42 mgHC/gRock. The Tmax varies between 342 to 450°C whereas the HI values vary from 33 to 241 mgHC/gTOC.
Rock Eval pyrolysis results suggest that these shales are high in TOC and the organic matter is characterized by type II and III kerogen suitable for the generation of gas. The HI vs Tmax plot for the shales from Tadkeshwar lignite mine indicate Type III kerogen which is suitable for the generation of gas (Fig. 27.2) and HI vs. Tmax plot for shales from Rajpardi lignite mine suggests that the organic matter is characterized by Type II kerogen which has potential for oil and gas generation (Fig. 27.3).The preliminary results from this study are encouraging, further subsurface studies involving lateral and vertical extents of the shale horizons, petrological and petrophysical details with the organic geochemical attributes of the shales shall help in delineating horizons suitable for the shale gas generation.
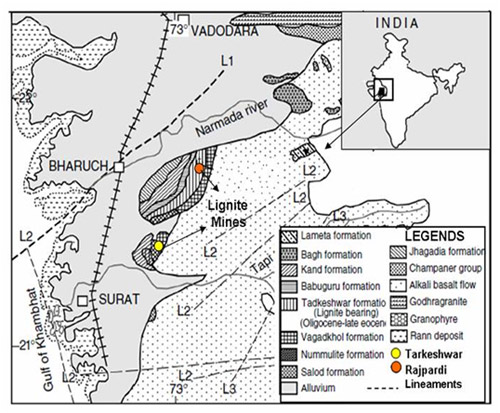
Fig.27.1:
Geological sample location map of lignite mines in Gujarat (after, Singh et al. 2012)
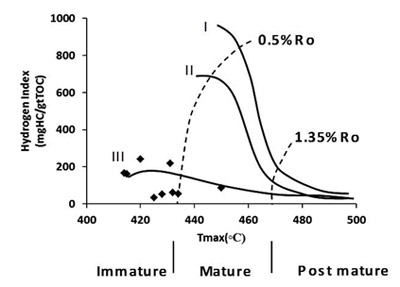
Fig.27.2:
The HI versus Tmax plot for the shales associated with lignites in Tadkeshwar lignite mine, Surat, Gujarat
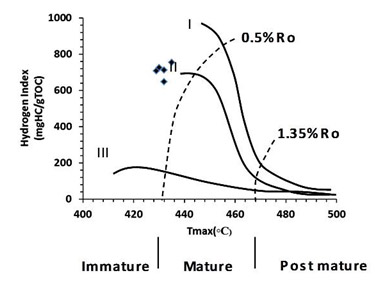
Fig.27.3:
HI versus Tmax plot for the shales associated with lignites in Rajpardi lignite mine, Surat, Gujarat
| Title | Delineation of electrical resistivity structure for HVDC Earth Electrode Station near Mathabhanga, West Bengal |
|---|---|
| Participants | A. Manglik, M.K. Sen, S. Thiagarajan, M. Suresh, Ankur Kumar, L. Adi Lakshmi, T. Sriyutha |
| Sponsoring Agency | Powergrid Corporation of India Limited |
Work Description:
A major requirement of High Voltage Direct Current HVDC system is erection of specially designed earth electrodes at two terminal ends in the case of normal setup and at multiple terminals in the case of multi-terminal setup. The earth electrodes, connected by transmission lines above the ground, use earth as return path to complete the circuit for current flow. The design parameters of these electrodes need the information about the electrical conductivity structure within a radius and depth of several km of the site in order to ensure that the injected current penetrates deep enough into the earth. Besides, detailed shallow conductivity structure of the electrode site covering an area of less than a square km is also needed to ensure safe limits for the step and touch potential at the site. We have carried out deep (MT) and shallow (DC imaging) resistivity investigations of a potential HVDC Earth Electrode Station site at Mathabhanga (W.B.) for Powergrid Corporation of India Limited (POWERGRID). A field configuration for DC imaging of the earth electrode site is shown in Fig.28.1 The results will be used by the sponsoring agency in decision making for its power transmission project.
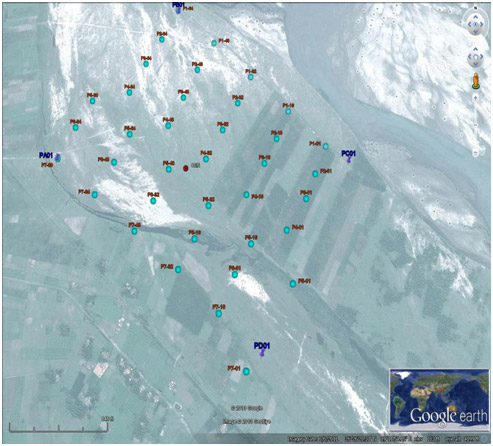
Fig.28.1:
Map showing profiles configuration for DC imaging covering the earth electrode site (map source Google Earth: www.google.com/earth/index.html). Circles are end-points of multicore cables.