Applied Science
| Title | Gravity & Magnetic Studies for Delineation of Structural Features in Mizoram |
|---|---|
| Participants | BijendraSingh, M.R.K.P.Rao,D.Ch.V.Raju,V.Vijaya Kumar, Niraj Kumar, B.Nageswararao, Ch.Swarnapriya, S. Purushotham |
| Sponsoring Agency | Oil India Limited, Duliajan, Assam |
Work Description:
Gravity and magnetic (G-M) surveys were carried out covering an area of about 7000 km2 in the Mizoram state over a part of Arakan-Yoma mountain fold belt to delineate the subsurface shallow structural features for hydrocarbon exploration. Bouguer anomaly map of the study area shows predominance of long wavelength regional component which decreases from west to east. In general, long wavelength Bouguer anomaly shows inverse correlation with regional topography of mountain fold belt of Mizoram suggesting isostatic compensation of excess topographic load created due to convergence of Indian plate below the Burmese plate.
The residual gravity anomalies obtained after removal of regional component reveal north-south trending highs and lows resulting from folding of shallow sedimentary strata which reflect anticlines and synclines formed due to compressional tectonics due to the convergence of Indian plate with the Burmese plate. Residual magnetic anomalies also depict N-S trending highs and lows with a significant high in the centre of the area. Since the sediments are usually considered as nonmagnetic, the anomalies were attributed to shallow magnetic sources due to presence of magnetization in the Bhuban strata. Presence of magnetic minerals in Bhuban rock samples supports the above contention. Fig15.2 shows the structural features/faults derived from horizontal gradient of gravity map coincide with the flanks of synclines and anticlines which are mostly aligned in the N-S direction.
2½ D joint modeling of G-M anomalies along selected profiles was performed using constraints from available seismic reflection results. Fig.15.3 shows a six layer section comprising of upper, middle and lower Bhuban, Renji and Jenam, Laisong and Disang overlying the basement reveals number of anticlines and synclines within the sediment while the basement is a dipping interface with depth varying from about 8.0 km in the NW to about 12.0 km in the south and east.
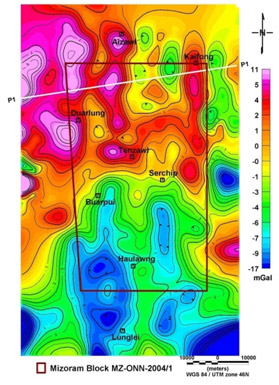
Fig.15.1:
Residual gravity anomaly map of the study area. Profiles 1-8 shown along which joint G-M modeling has been performed using constrained from seismic results.
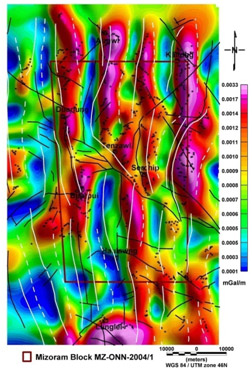
Fig.15.2:
Horizontal gradient map of CBA. It shows alternate maxima and minima associated with the flanks and synclines respectively. Superposed on this trend is plotted surface expression of anticlines (continuous lines), synclines(broken lines) and faults (black continuous lines)
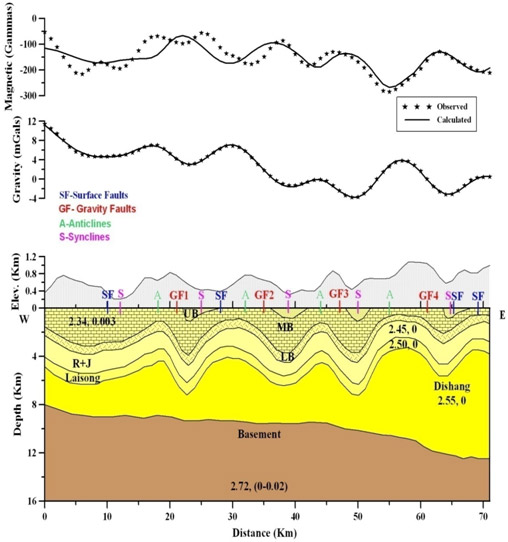
Fig.15.3:
Geological section derived from modeling of gravity and magnetic anomalies along profile. It depicts folded structure in the sedimentary section and dipping basement towards the east.