Basic Science
| Title | Seismic signatures of the crust beneath the Godavari rift. |
|---|---|
| Participants | Arun Singh, M. Ravi Kumar, Narendra Kumar, Dipankar Saikia, P. Solomon Raju, D. Srinagesh, N. Purnachandra Rao, Dipankar Sarkar |
| Sponsoring Agency | CSIR-NGRI, MOES |
Work Description:
The Godavari rift valley in the south Indian shield that sutures the Dharwar and Bastar cratons is a very less studied region in terms of its deep seismic structure. In the present study, a total of 1559 receiver functions from 777 earthquakes registered by a 10 station network are utilized to investigate crust and mantle structure (Fig.13.1). Broadly, the crustal architecture underneath the rift appears very complex with the presence of intracrustal layers and a weak Moho compared to a sharp Moho and a simple crust outside it (Fig.13.2). Detailed modelling of receiver functions at 6 stations using the Nearest Neighbourhood Algorithm approach reveals a 40 km thick crust within the rift compared to a 33 km thick crust in the adjacent Dharwar craton (Fig.13.3). Also, the lower crustal character is found to be distinctly different, with a faster lower crust beneath the rift. A weak Moho beneath the rift may be due to magmatic underplating. The transition zone (660–410 km) structure inferred from the common conversion point stacks of receiver functions can be interpreted in terms of the absence of (a) thermal anomalies within and above the mantle transition zone (MTZ) (b) thin lithosphere or high temperatures in the uppermost mantle. Magmatic underplating within the crust and a normal MTZ argue in favour of a rift formed due to lithospheric stretching without the influence of a mantle plume.
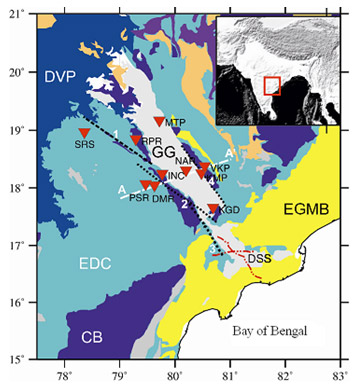
Fig.13.1:
Tectonic map of the Godavari region with the prominent faults and seismic stations (inverted triangles). The inset shows the study region in India. The deep seismic sounding profiles are indicated as red dotted lines. The while dashed line A–A represents the gravity profile (Mishra et al., 1987). DVP: Deccan Volcanic Province; EDC: Eastern Dharwar Craton; GR: Godavari rift; EGMB: Eastren Ghat Mobile Belt; 1, Kaddam Fault; 2, Kinnerasani-Godavari Fault; 3, Kolleru-Lake Fault; 4, Godavari Valley Fault
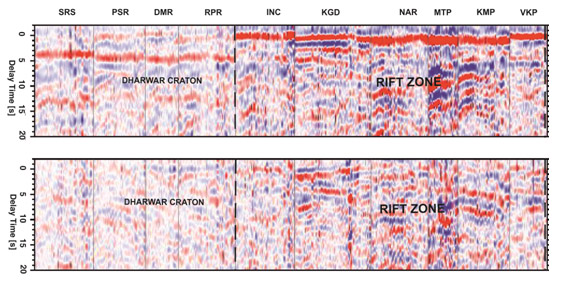
Fig.13.2:
Radial (top panel) and transverse (bottom panel) receiver functions at stations. The traces are first grouped in 72 backazimuthal bins and then sorted by slowness in each bin. Stations are sorted from south to north. Positive amplitudes are represented by red and negative ones by blue. A total of 1559 receiver functions are used to construct this image.
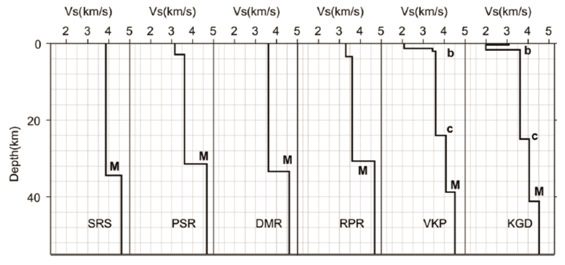
Fig.13.3:
Crustal models obtained through inversion. Prominent layers are marked by M, c and b. M: Moho; c: Crustal layer; b: Basement. The simple crust beneath stations DMR and SRS, does not necessitate intracrustal layers to be incorporated in modelling.