Basic Science
| Title | DEEP GEO-ELECTRIC STRUCTURE OF THE DHARWAR CRATON (INDIA) INFERRED FROM MAGNETOTELLURIC STUDIES |
|---|---|
| Participants | K. Veeraswamy, K.K. Abdul Azeez, Prasanta K. Patro, A.K. Gupta, Narendra Babu, T. Harinarayana |
| Sponsoring Agency | CSIR-NGRI |
Work Description:
Broadband and long period magnetotelluric (MT) investigations along SW-NE oriented traverse from Chikmagalur (west) to Anantapur (east) of ~300 km have been conducted as a part of geological and geophysical imaging of Dharwar Craton. Bradband MT data has been acquired at 50 locations with a station interval of 6-8 km, and long period MT (50 - 15000 sec) data at 15 locations with spacing of 20-25 km(Fig 18.1.). Continuous MT time-series measurements over a period of about 3 days were made at each MT sounding location, while 10-12 days continuous recording were made for each LMT measurement site. Prior to modeling of the data set for meaningful conductivity structure along the profile, the MT data were analyzed to determine the dimensionality and appropriate geo-electric strike values. A value of -150 (N150W) estimated from multi-site, multi-frequency analysis is assumed as the regional geo-electric strike for the profile, which also corroborates with the surface geological trends in the area. The 2D electrical section shows (Fig 18.2.) high resistive (>10000 Ohm-m) top layer (up to 20 km) beneath the western part as compared to ~25 km thickness in the eastern Dharwar craton corroborating well with geological, deep seismic and other geophysical results. The top layer in the geoelectric section appears as a block structure, while at deeper levels (> 80 km) the electrical structure under WDC & EDC are significantly different. The model reveals a major deep vertical electrical discontinuity between WDC and EDC, which coincides with the eastern boundary of Chitradurga Schist belt on the surface. The model also shows that the base of lithosphere under WDC is relatively less resistive as compared to its counterpart under EDC. This probably suggests the alteration in resistivity characteristics due to the higher thermal effects imparted by the Reunion plume under WDC, which was located towards west of WDC during the 65-60 Ma period.
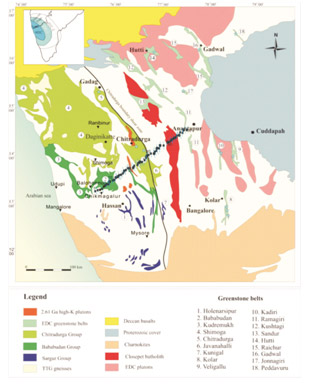
Fig.18.1:
The major geological features in Dharwar cratonic region. MT locations along with the best strike values estimated from the individual site using the method of Becken & Burkhardt (2004) are also shown.
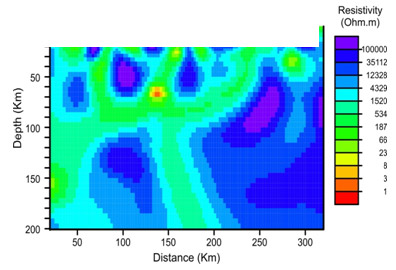
Fig.18.2:
Lithospheric scale resistivity model of the Chikmagalur-Anantapur profile, showing the main features resolved by the inversion process. Tectonic boundary between WDC and EDC has been reflected as a conducting interface.