Basic Science
| Title | Attenuation Character of Seismic Waves in Sikkim Himalaya |
|---|---|
| Participants | Pinki Hazarika, M. Ravi Kumar |
| Sponsoring Agency | CSIR-NGRI |
Work Description:
In this study, we investigate the seismic wave attenuation beneath Sikkim Himalaya using P, S and coda waves from 68 local earthquakes registered by eight broad-band stations of the SIKKIM network (Fig. 36.1, Fig. 36.2). The attenuation quality factor (Q) depends on frequency as well as lapse time and depth. The value of Q varies from
(i) 141 to 639 for P waves,
(ii) 143 to 1108 for S waves and
(iii) 274 to 1678 for coda waves, at central frequencies of 1.5 Hz and 9 Hz, respectively. The relations that govern the attenuation versus frequency are Qα = (96 ± 0.9) f (0.94 ± 0.01), Qβ= (100 ± 1.4) f (1.16 ± 0.01) and Qc= (189 ± 1.5) f (1.2 ± 0.01) for P, S and coda waves, respectively (Fig. 36.3). The ratio between Qβ and Qα is larger than unity, implying larger attenuation of P compared to S waves. Also, the values of Qc are higher than Qβ . Estimation of the relative contribution of intrinsic (Qi) and scattering (Qs) attenuation reveals that the former mechanism is dominant in Sikkim Himalaya. We note that the estimates of Qc lie in between Qi and Qs and are very close to Qi at lower frequencies. This is in agreement with the theoretical and laboratory experiments. The strong frequency and depth dependence of the attenuation quality factor suggests a highly heterogeneous crust beneath the Sikkim Himalaya. Also, the high Q values estimated for this region compared to the other segments of Himalaya can be reconciled in terms of moderate seismic activity, unlike rest of the Himalaya, which is seismically more active.
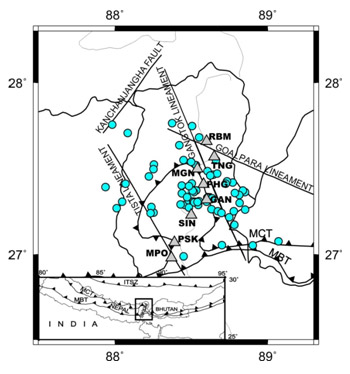
Fig.36.1:
Map of Sikkim Himalaya with the major tectonic features showing the locations of earthquakes (circles) and seismic stations (triangles) used in this study. Bottom panel shows a simplified tectonic map of central and eastern Himalaya enclosing Sikkim with an open rectangle.
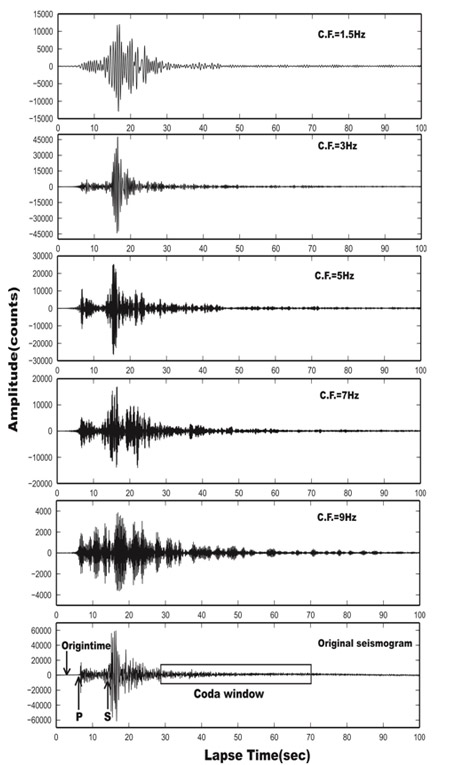
Fig.36.2:
Examples of original and filtered seismograms recorded at seismic station MPO due to an earthquake that occurred on 2006 May 3.
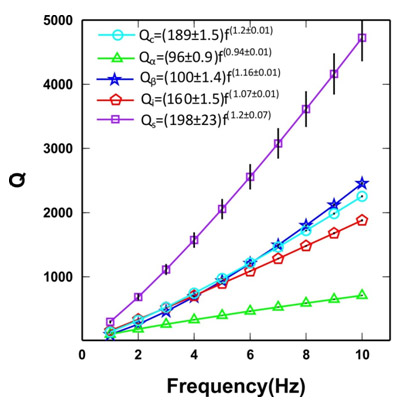
Fig.36.3:
Plot showing the frequency dependency of Qc, Qα, Qβ , Qi and Qs values estimated in this study for Sikkim Himalaya.