Basic Science
| Title | Novel techniques for geophysical modeling |
|---|---|
| Participants | S K Ghosh, A Vasanthi |
| Sponsoring Agency | CSIR |
Work Description:
1. Extraction of symmetric and antisymmetric signals embedded in Gaussian white noise.
We begin with symmetric signals and focus first on finding its midpoint of symmetry. Two methods have been developed to meet this goal.
- (a) In the first method, the noisy trace and its time reverse are cross correlated. Given a favourable signal to noise ratio, the peak of the cross correlation and the corresponding time lag provide a clue for the location of the midpoint of symmetry of the signal.
- (b) In the second method, we conceive of a cyclic permutation of the noisy trace in which each point on the trace is made, turn by turn, the midpoint. For each choice, the trace is split into its odd and even components with respect to its current midpoint. Then energies of the even and odd part and their difference are noted for each permutation. The choice of the midpoint which leads to the maximum energy difference is the location of the midpoint of symmetry of the symmetric signal.
- (c) We focus on the specific permutation resulting in the maximum energy difference and the corresponding even and odd components of the trace with respect to its midpoint. While the even component contains both signal and noise the odd component contains only noise. This step results in the exclusion of half the noise approximately. The odd component is useful in that it can provide the statistics of the noise.
- (d) Only the inner segment of the even component (called even trace hereafter) contains signal along with noise, while the segments on the fringes contains only noise. Our goal is to approximately determine the onset point of the signal. For this we first determine the statistics of the original Gaussian white noise. Its variance would be double the variance of the odd component. We generate several samples of the Gaussian white noise and split each into odd and even components about the midpoint of each of the noise trace. The even components would yield the statistics of the noise present in the even trace extracted earlier.
Several algorithms have been constructed to determine the onset of the signal in the even trace. All rely on the changed statistic of the trace after the signal sets in. For example when several consecutive values in the even trace exceed the standard deviation of the estimated noise, the signal can be thought to have set in. As safety margin, some points before the estimated onset are also included.
The points before the signal onset and those after the signal ends are now excluded from the even trace. This step enables a second phase of noise reduction. - (e) Assuming that the noise is of far wider band than the signal a similar approach as above is feasible in the frequency domain as well. This will determine the approximate band limit of the signal. Exclusion of energy outside this band will further increase signal to noise ratio. This results in a crude estimate of the signal.
- (f) Finally, a formula due to Wiener yields an improved estimate of the signal from a crude estimate.
Thus we have developed a method for locating and estimating a symmetric signal embedded in white noise. While Figure 41.1(a) depicts the symmetric signal embedded in noise, Figure 41.1(b) depicts the extracted signal on an overplot of the original signal. - (g) The method for extracting an antisymmetric signal is developed along a similar line involving the odd component of the signal plus noise trace. While Figure 41.2(a) depicts the anti-symmetric signal embedded in noise, Figure 41.2(b) depicts the extracted signal on an overplot of the original signal.
2. Extraction and location of a signal with a given phase
For a signal whose phase is known and which is embedded in noise, one can subtract the phase by transforming the noisy trace to the frequency domain. An inverse Fourier transform then results in a symmetric signal embedded in white noise. The steps for locating the signal and its extraction are then same as for a symmetric signal. The phase can be added to the symmetric signal after estimating it. While Figure 41.3(a) depicts the signal of a given phase embedded in noise, Figure 41.3(b) depicts the extracted signal on an overplot of the original signal.
3. Analysis of potential field data over Cauvery Basin
The analyses of gravity, magnetic and bathymetry data delineated a number of geologic features hitherto unreported with regard to the mosaic of the Cauvery Basin, such as a zone of subsidence and especially the focal region of the 2001 Pondicherry earthquake. The residual gravity and magnetic anomalies, derived by a relatively new finite element approach, reveal a good correspondence between the geophysical data on the one hand and the distribution of sedimentary rocks on the other. A positive residual gravity anomaly shows that the entire Cauvery Basin is subsiding.
4. Analysis of gravity signatures over Impact Craters
The sudden extinction of the dinosaurs was assigned to the catastrophic impact of an asteroid or comet with Earth around 65 ma ago. Large impacts beyond doubt played important roles in the evolution and development of life on Earth. These terrestrial bodies hit the Earth at very high velocities generating enormous heat and pressure. In general, the densities of these bodies and the rocks at the surface of the Earth vary considerably, thereby making gravity method admirably suitable for identification and exploration of the impact structures. Gravity method has been widely used to determine the shape, size of the crater and the mass deficiency. The Bouguer gravity data of three well known impact craters, namely, Manicouagan, Sudbury and Chicxulub from Canada and Mexico have been reprocessed in order to know the accurate tectonic framework and mass deficiency.
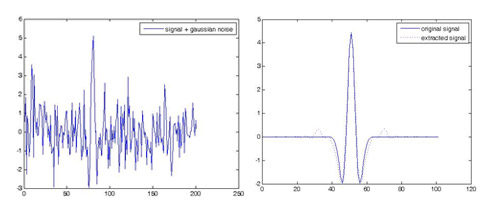
Fig.41.1:
(a) Symmetric signal embedded in noise, 1(b) Extracted signal on an overplot of the original signal.
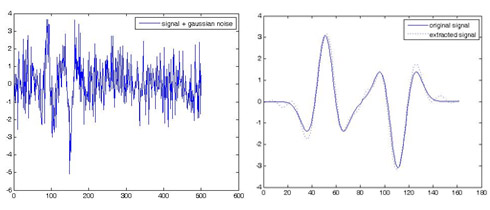
Fig.41.2:
(a) Anti-symmetric signal embedded in noise, 2(b) Extracted signal on an overplot of the original signal.
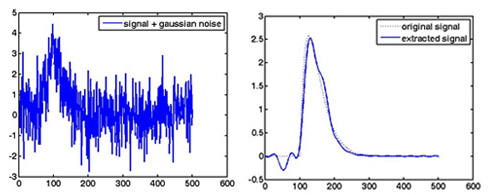
Fig.41.3 (a,b):
(a) Signal with a given phase embedded in noise, 3(b) Extracted signal on an overplot of the original signal.